Recorded sales at this address
4 recorded sales
A previous sale is a useful reference, but its date and any changes to the home matter. It is not today's value.
Valuation NSW · dates and prices in Sale history below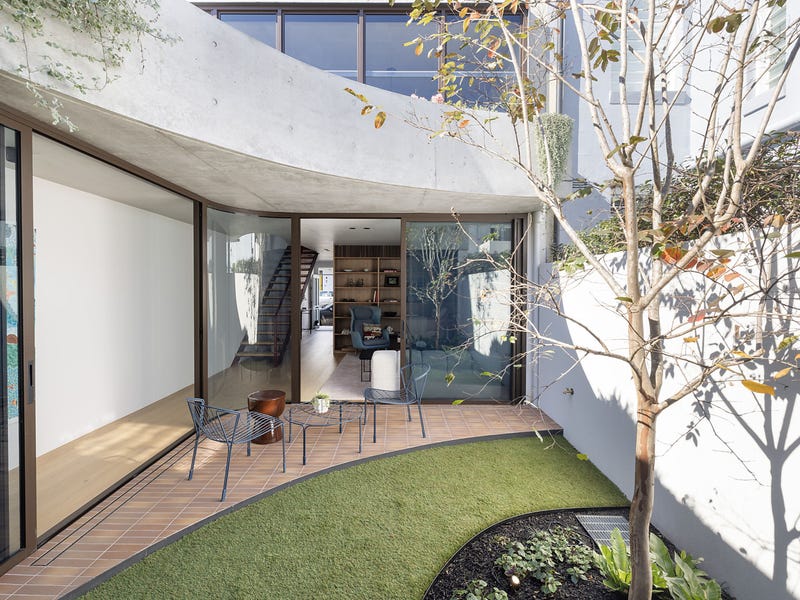
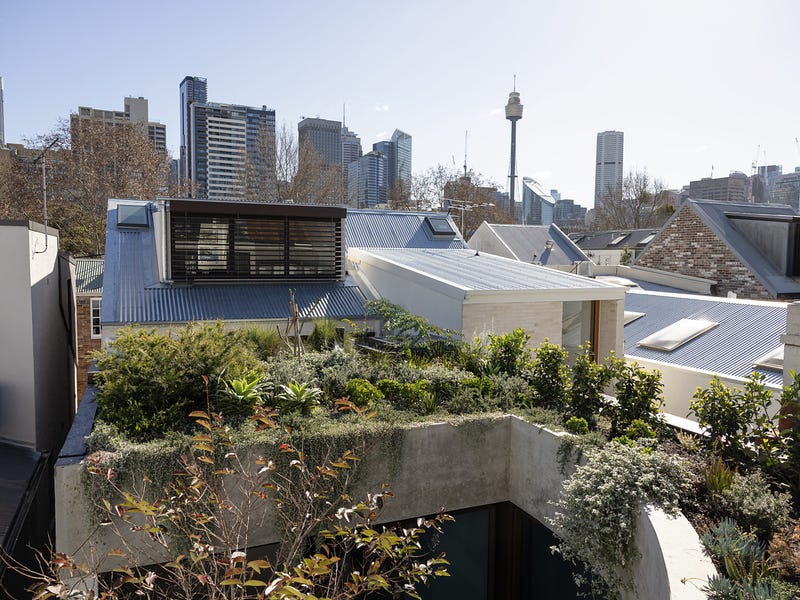
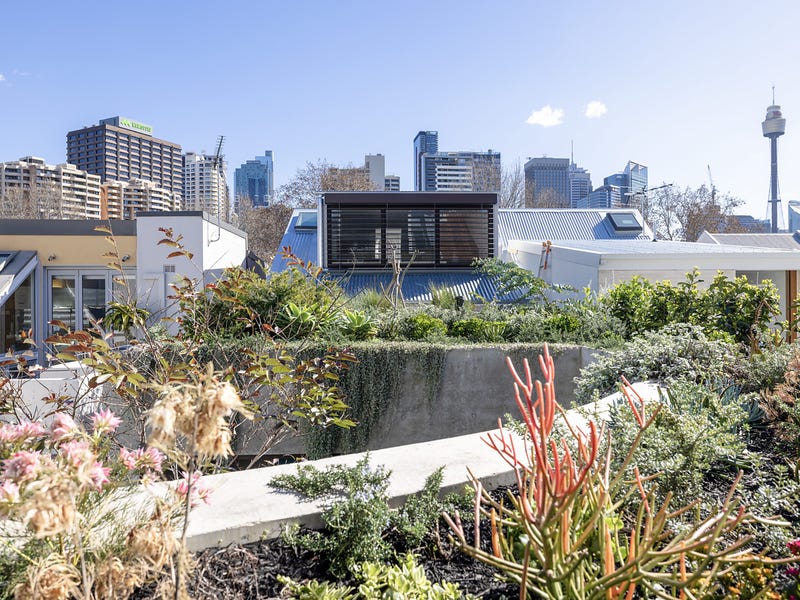
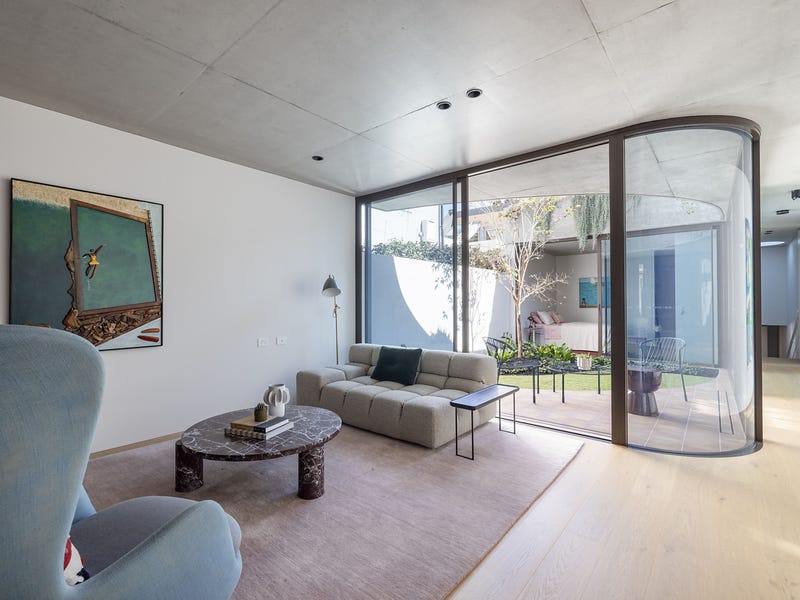
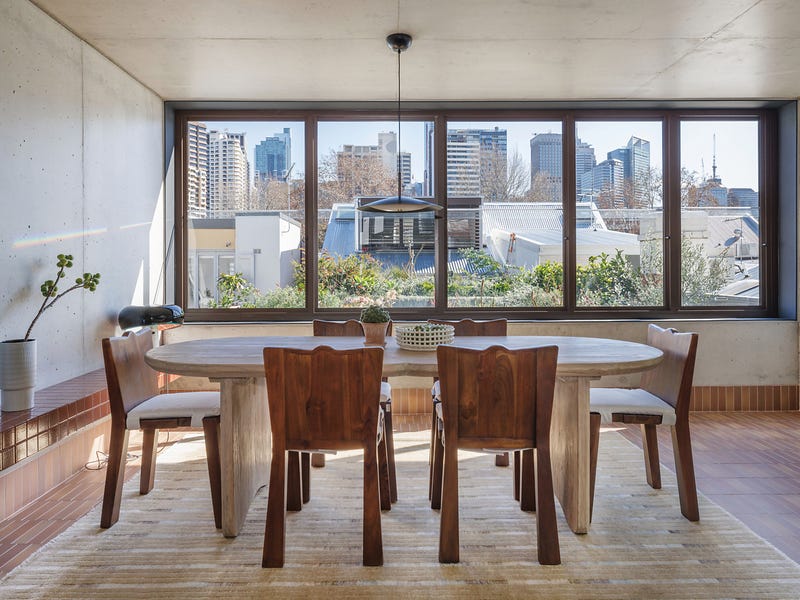
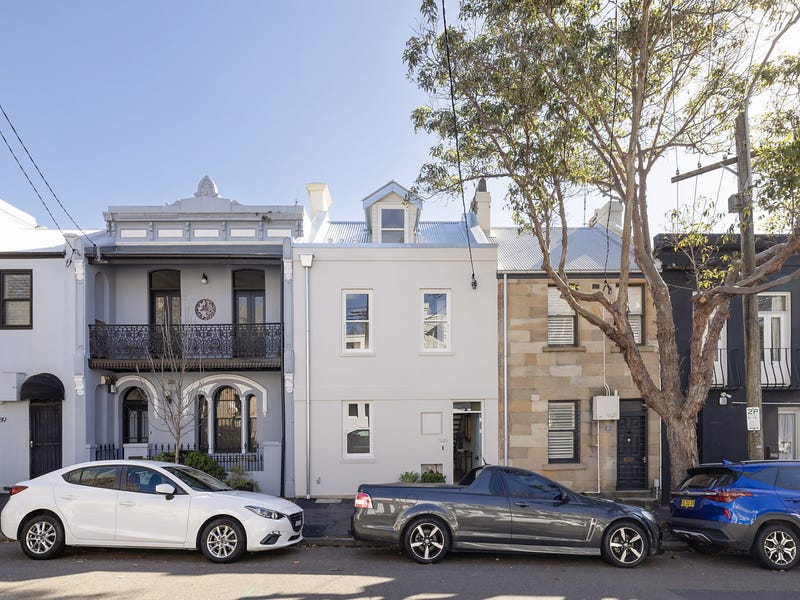
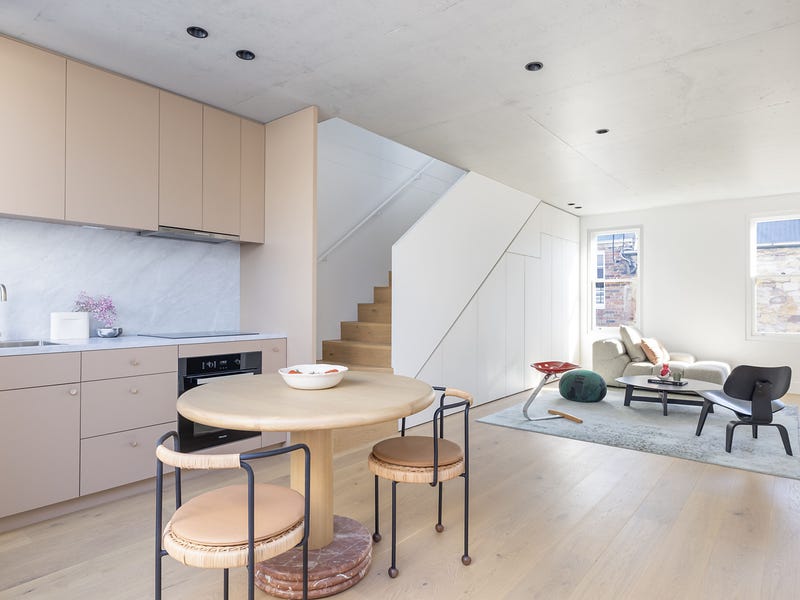
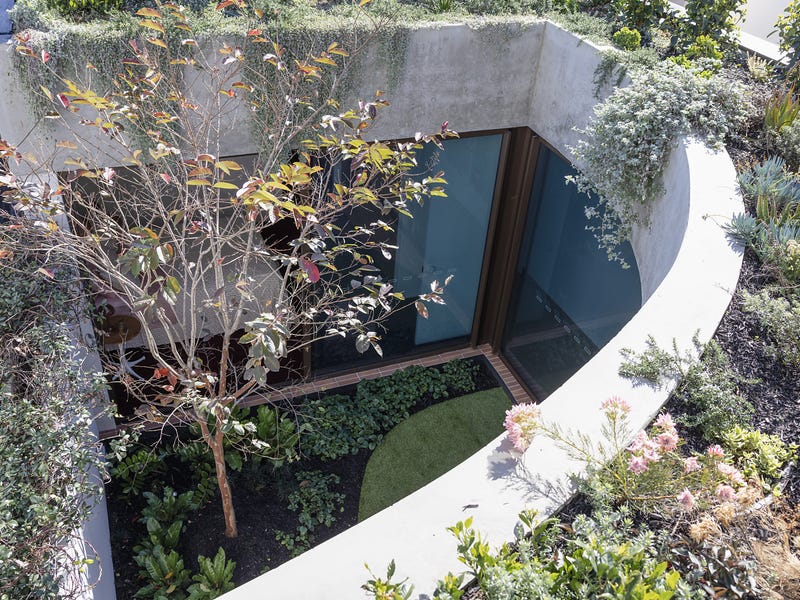
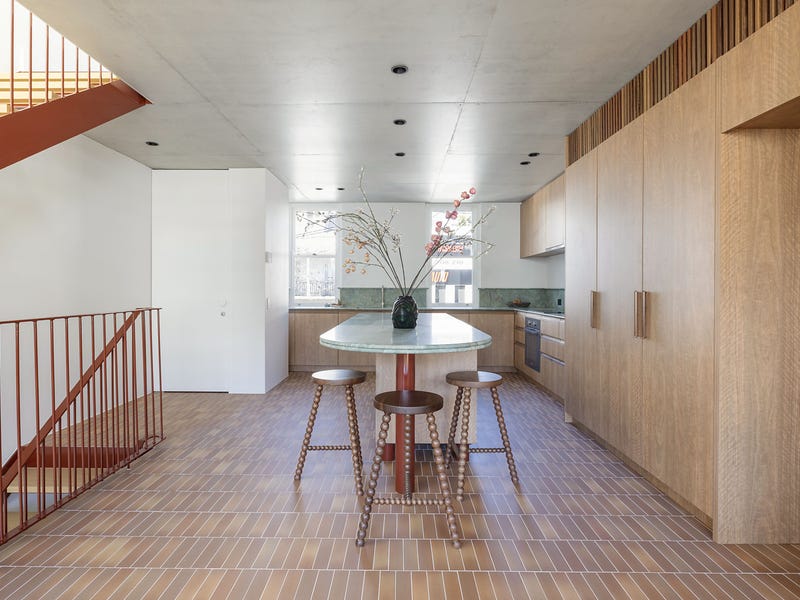
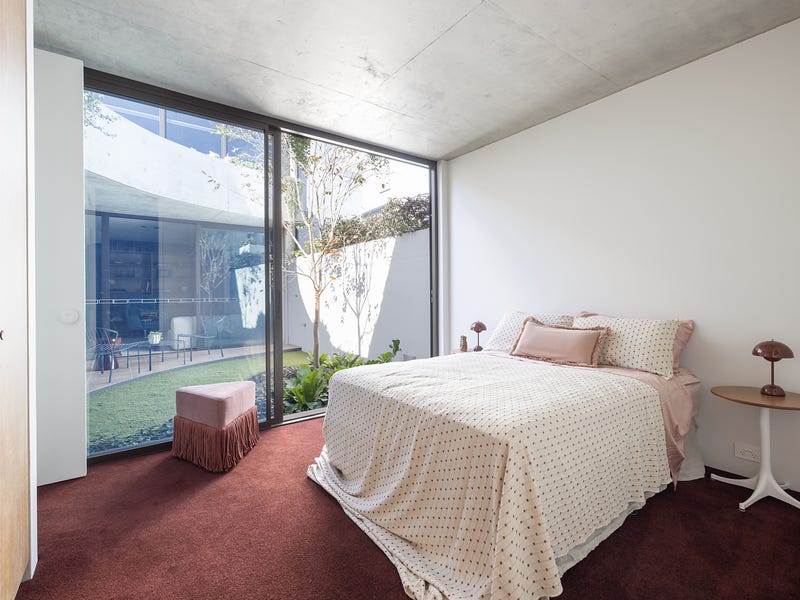
4 bed · 4 bath · 2 car · House
Confirmed against published auction results.
Your buyer evidence guide
The useful records, what they mean, and the questions they leave open. Start here, then explore the evidence below.
Recorded sales at this address
A previous sale is a useful reference, but its date and any changes to the home matter. It is not today's value.
Valuation NSW · dates and prices in Sale history belowHow much price evidence fits
The wider pool is not a set of identical homes. Bedroom count, condition and location within the suburb affect comparability.
Published auction evidence · model trained through 2026-09-15Planning activity nearby
An application is not an approval or a promise that building work will happen. Location and stage matter.
NSW Planning Portal · individual records in Explore the areaNo dated campaign events are available here. That does not establish that the asking price or agent has never changed.
Use these with the agent and your independent advisers. An answer is something to verify, not a fact we have recorded.
The estimate is a model output. The records are evidence. Your inspection and document checks fill the gaps.
This is a comparison with the evidence we hold, not a valuation or a recommended offer.
Confidence: Low — based on 47 comparable auction sales (1 of this exact configuration) · model runs ±16% for this configuration · confidence held at Low — under 20 same-configuration sales · priced from this property's own records: block size, land value, previous sale · thin comparable support for this configuration — read the range as wider, not as a warning
| Address | Config | Sold | When |
|---|---|---|---|
| 160 Bourke St | 4 bd · 3 ba | $2.67M | Dec 2024 |
| 68 Yurong St | 4 bd · 3 ba | $3.45M | Nov 2024 |
crime index: 100 — well above sydney average · 11 min walk to Kings Cross · ~5 min train to the CBD · trains ~every 4 min at peak
These are due-diligence prompts, not a verdict on this property.
$1350–$1750/wk is what 4-bed houses in 2010 actually transact for (middle half of 15 bonds lodged, Q2 2026 · median $1585/wk — NSW Fair Trading, CC BY).
2019Q1 → 2026Q2: $750 → $1150/wk · +8% over the last 12 months (latest four quarters averaged against the previous four) — quarterly new-tenancy medians for houses in 2010, all bedroom counts pooled.
Asking rents are what agents hope for; bond figures are what tenants actually signed at (NSW Fair Trading bond lodgements, CC BY). No yield % is derived here: each rent above is a different grain from this home's price, and a ratio of two grains reads as precision it doesn't have. New-tenancy rents run hotter than sitting rents. Not financial advice.
Refuses 2.61% of the development applications it decides · off-street parking 3.08% (determinations to Nov 2023).
The full outlook — every category with confidence ranges, which plan elements come unstuck, and the heritage effect by category — is under Explore the area.
| Auction week | Result | Price | Agency |
|---|---|---|---|
| 10 Oct 2026 | Sold prior | withheld | Sydney Sotheby's International Realty |
| 5 Sept 2026 | Postponed | withheld | Sydney Sotheby's International Realty |
From Domain's published weekly auction results — individual outcomes as published; withheld prices stay withheld.
The 6 listings above are on the market now: same house category, within 1 bedroom of 4, asking within 20% of this one, in Darlinghurst or a suburb whose centre is within 3 km — ordered by how close the asking price is. That is the whole rule: a filter, not a recommendation, and nothing here judges which home is better.
| Exchanged | Price | Change since prior sale |
|---|---|---|
| 16 Sept 1991 | $230,000 | — |
| 6 Nov 2015 | $1,376,000 | +498.3% over 24.1 yrs |
| 23 Mar 2019 | $2,055,000 | +49.3% over 3.4 yrs |
| 3 June 2023 | $3,100,000 | +50.9% over 4.2 yrs |
Settled-sale records from the NSW Valuer General's Property Sales Information. Dates are contract (exchange) dates; sales appear only once lodged, so the most recent months are incomplete and revise upward — never read the latest month as final. Two entries on one date are usually a single transaction recorded across parts. © State of New South Wales (Valuation NSW).
A mix of housing types — houses through to apartments — permitted.
Heritage conservation area — East Sydney. The property sits in a heritage conservation area — the streetscape is protected, so visible/external changes are controlled. It's area-wide, not this building specifically; it tends to preserve character and value.
Registered lots in Darlinghurst run 50–170 m² (middle 80% of 30 registered parcels). This one is 164 m² — inside that range.
Whether a block this size can be subdivided or redeveloped is a separate question: minimum lot size, setbacks and the council's DCP controls decide it, and this page doesn't check them. One point per registered parcel, so a tower's parent lot counts once — not once per unit. Confirm the parcel and its controls with the council before you inspect.
Zone R1 (General Residential) under the SYDNEY LEP · heritage from the NSW Heritage Map layer, as recorded against this property in the NSW Valuer General's valuation record — a guide, not a parcel-level legal check. Confirm the exact lot at the NSW Planning Portal.
| If you wanted to… | Refused | vs NSW | Applications decided |
|---|---|---|---|
| Alterations & additions | 1.93% (1.34–2.78%) | 0.7× (NSW 2.63%) | 28 refused of 1,450 · 13 approved with conditions |
| Off-street parking | 3.08% (0.85–10.54%) | 1.2× (NSW 2.58%) | 2 refused of 65 · 1 approved with conditions |
| Pool, deck or fence | 3.41% (1.57–7.24%) | 2× (NSW 1.73%) | 6 refused of 176 |
| Granny flat | 3.13% (0.55–15.74%) | 0.7× (NSW 4.45%) | 1 refused of 32 · 1 approved with conditions |
| Knock down & rebuild | 5.63% (2.88–10.72%) | 0.5× (NSW 11.55%) | 8 refused of 142 · 4 approved with conditions |
Across all application types Council of the City of Sydney refused 2.61% (2.08–3.26%) of the 2,839 development applications it decided.
The refusal rate above says how strict the council is. This says which part of a plan is exposed — measured across all 192,284 NSW development applications, not just this council. Each is an association: plenty of applications carrying these elements are approved, and nothing here is a verdict on a proposal you haven't made yet.
Heritage does not make everything harder — it depends entirely on what you want to do, and for some work it makes approval more likely. Measured across NSW by category:
These are NSW-wide rates for heritage-affected applications, not Council of the City of Sydney-specific, and they describe applications rather than this property. The zoning section above records the actual listing at this address.
Determinations lodged on the NSW Planning Portal up to Nov 2023 — the published dataset stops there, so this is a record of how the council has behaved, not a forecast and not a statement about any particular application. Rates cover development applications only; modifications and reviews of an earlier decision are excluded. A rate is shown only where at least 30 applications were decided — below that the counts are given instead, because a percentage from a handful of decisions is not a fact about a council. "Approved with conditions" is a consent, not a refusal, and is never counted as one.
| Where | Proposal | Status | Outcome | Est. cost | Lodged |
|---|---|---|---|---|---|
| ~25 m · 161 Palmer Street Darlinghurst 2010 | Dwelling House, Alterations Or Additions To An Existing Building Or Structure · 1 new dwelling | Additional Information Requested | not on record | $451k | 2026-08-27 |
| ~79 m · 134 Crown Street Darlinghurst 2010 | Dwelling House, Alterations Or Additions To An Existing Building Or Structure · 1 new dwelling | Withdrawn | not on record | $610k | 2026-06-11 |
| ~102 m · 82 Stanley Street Darlinghurst 2010 | Other | Determined | Approved | $12k | 2020-07-20 |
| ~102 m · 82 Stanley Street Darlinghurst 2010 | Other | Withdrawn | not on record | — | 2020-11-19 |
| ~102 m · 17 118-126 Crown Street Darlinghurst 2010 | Commercial Development, Advertising And Signage, Change Of Use Of Land Or A Building Or The Classification Of A Building Under The Building Code Of Australia | Withdrawn | not on record | $205k | 2026-07-24 |
| ~102 m · 27 118-126 Crown Street Darlinghurst 2010 | Commercial Development, Change Of Use Of Land Or A Building Or The Classification Of A Building Under The Building Code Of Australia | Withdrawn | not on record | $205k | 2026-08-13 |
Development application data © NSW Department of Planning and Environment, used under CC BY 4.0. Matched at this exact address or within ~150 m of its geocoded point — proximity evidence, not a parcel-level check. Lodged means proposed, not approved or built. Outcome comes from a separate NSW dataset that stops in Nov 2023: applications determined after that, or still undetermined, read “not on record” — which means we don't know, never that it was refused. “Status” is the council's own workflow state and “Determined” on its own does not say which way it went. Verify any application on the NSW Planning Portal.
2026-09-21 — Landbank / amalgamation — listing's own words: "amalgamat" (75/1 Tewkesbury Avenue, Darlinghurst, NSW 2010) (listing rea-151054804 (rea), first seen 2026-09-21)
2026-08-16 — Development site — listing's own words: "STCA" (203/150 Liverpool Street, Darlinghurst, NSW 2010) (listing rea-151969392 (rea), first seen 2026-08-16)
2026-08-14 — DA-approved site — listing's own words: "DA-approved" (439 Liverpool Street, Darlinghurst, NSW 2010) (listing rea-151755924 (rea), first seen 2026-08-14)
Dated public signals compiled for this suburb — openings, closures, site sales and institutional moves. Facts with sources, not forecasts.
Crown St PS (primary) · Inner Sydney HS (secondary)
7 primary schools within 2 km · ICSEA ~1116 — the socio-educational advantage of the school community (My School, national average ~1000): a demographic measure, never a results or quality score.
NSW DoE intake zones at this address's geocoded point — tighter than a suburb-level guess, but geocodes carry a few metres of error and boundaries change with reviews. Verify the exact address at School Finder. Intake zones cover government schools only.
Check any Sydney suburb free — Market Mint market-conditions readout, live median, clearance trend and the price model — at aipropertyeye.com. No sign-up for the suburb check; the full board is 7 days free.
Data from published auction results (Domain) and live portal listings. Estimates are never valuations or financial advice. Own this home and want a result corrected? hello@aipropertyeye.com.