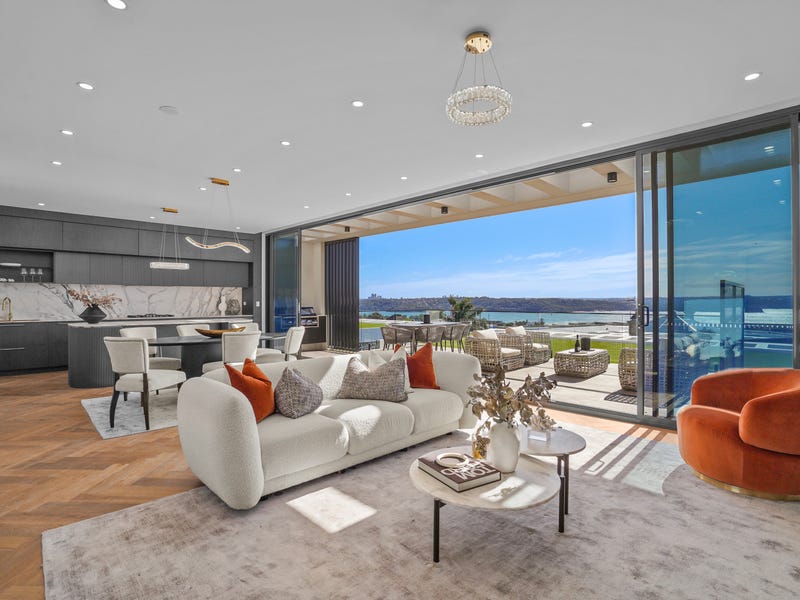
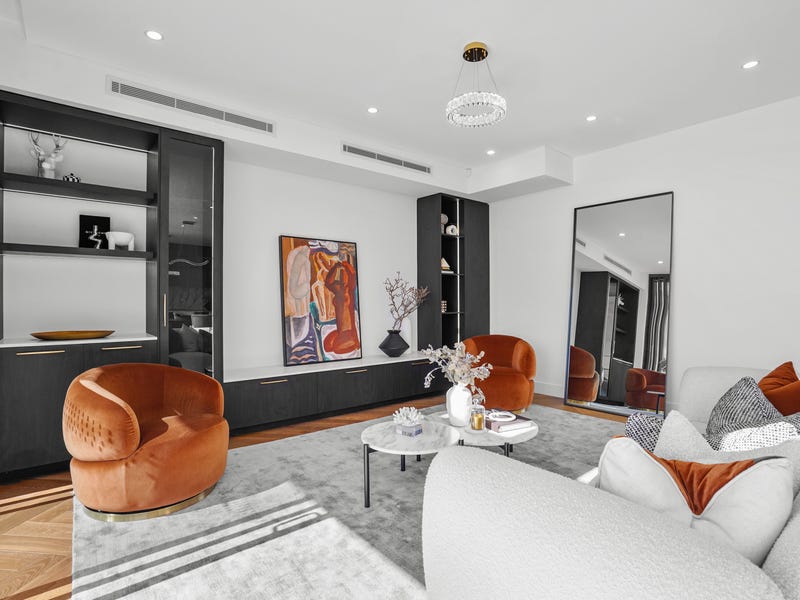
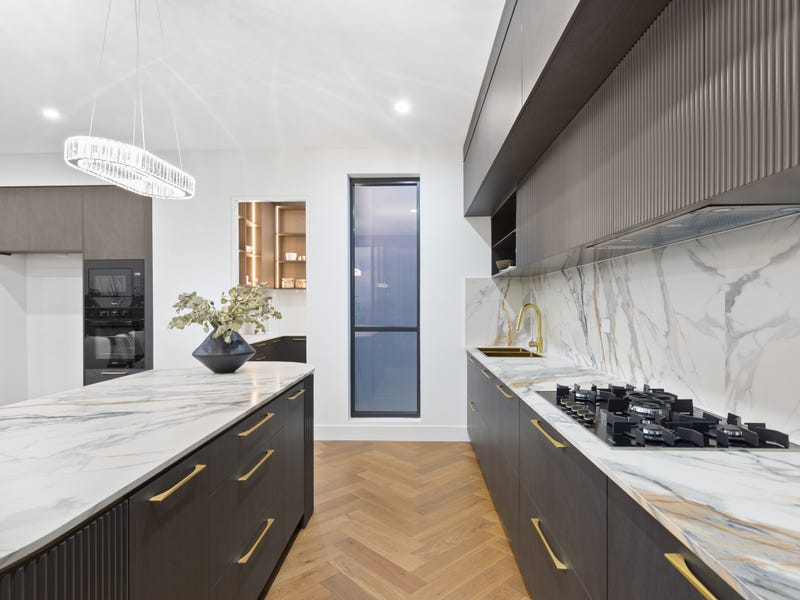
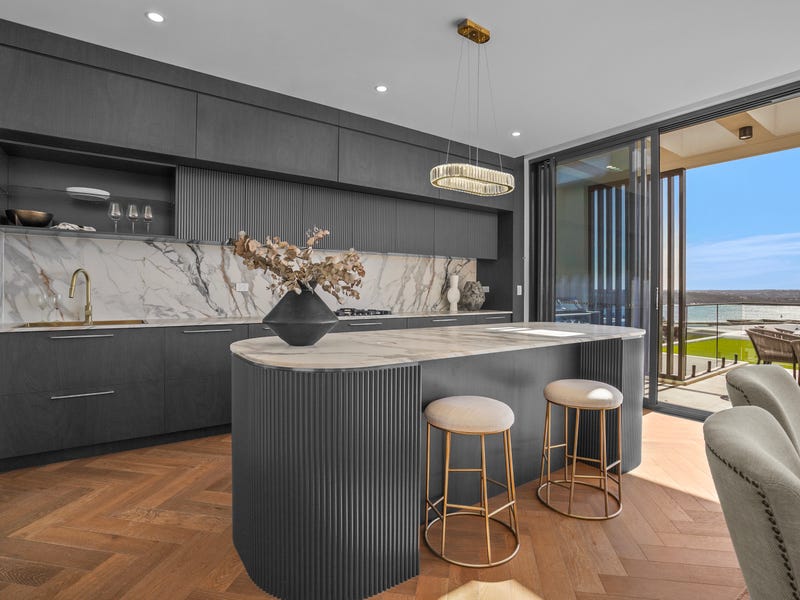
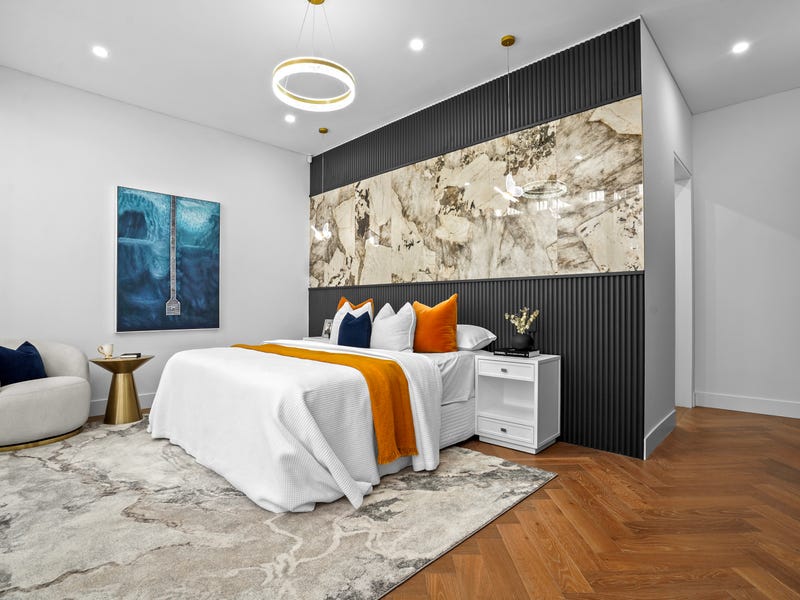
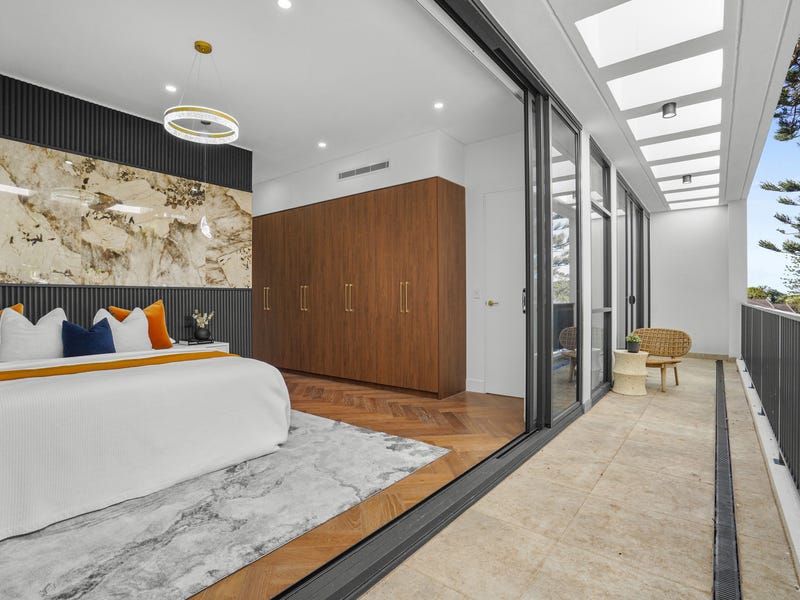
Currently listed
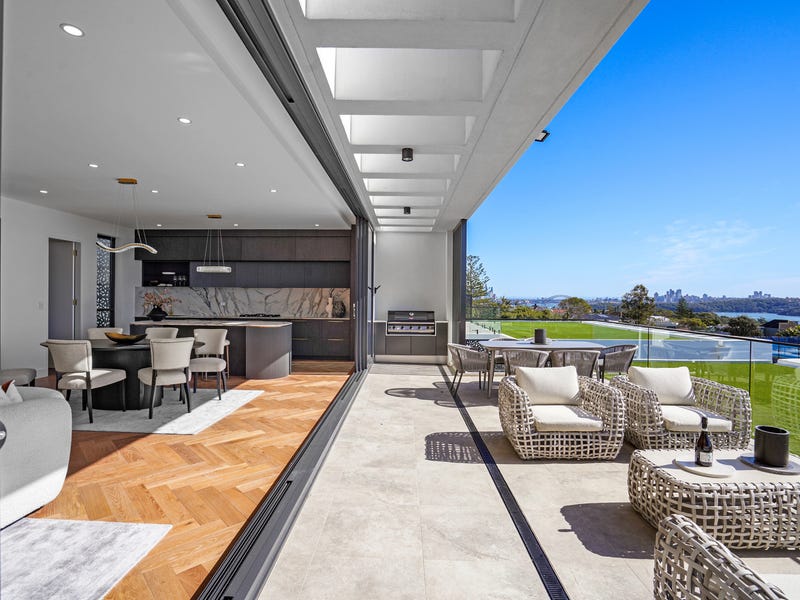
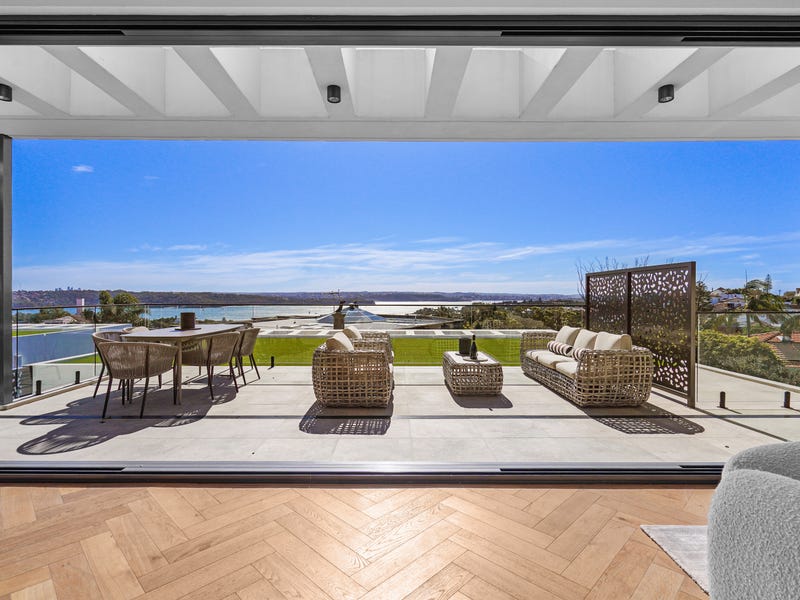
5 bed · 5 bath · 2 car · Duplex
The Property Brief — what the evidence shows. You draw the conclusion.
What we've tracked
- 18 Aug 2026 first tracked by our radar (the portal doesn't publish its list date)
- 28 Aug 2026 on market 10+ days — first tracked by us, a lower bound
Suburb risk flags
crime index: 21 — below sydney average · 33 min walk to Rose Bay Wharf · ~25 min ferry to the CBD · ferries ~every 40 min at peak
Where every number comes from
- Evidence trail: tracked by our radar from portal listings, web-archive checks and published auction results — each entry dated
- Risk flags: suburb-level overlays (BOCSAR crime, flood/bushfire intel, aircraft bands, GTFS transit) — NOT a per-parcel assessment
⏱ Days on market — this campaign
10 days since our daily sweep first saw this listing.
The portal's own campaign may have started slightly earlier than our first sighting. Longer campaigns tend to mean more negotiating room — the board's "Longest listed" sort exists for exactly that reason.
Rent evidence — asking vs transacted, Vaucluse · postcode 2030
$985/week median new-tenancy rent for units in 2030 (2026Q2, 61 bonds lodged — all bedroom counts pooled).
2019Q1 → 2026Q2: $698 → $985/wk · +6% over the last 12 months (latest four quarters averaged against the previous four) — quarterly new-tenancy medians for units in 2030, all bedroom counts pooled.
Asking rents are what agents hope for; bond figures are what tenants actually signed at (NSW Fair Trading bond lodgements, CC BY). No yield % is derived here: each rent above is a different grain from this home's price, and a ratio of two grains reads as precision it doesn't have. New-tenancy rents run hotter than sitting rents. Not financial advice.
Growth trend — Vaucluse units at auction
Not enough Vaucluse unit auctions on record to show a trend — this fills in as the archive grows.
Suburb-level, from published auction results. No single building has enough sales for a block-level series, so this is the honest grain; sales-mix shifts move raw medians, and the measured rate (when shown) controls for bed count.
Construction risk — what no listing tells you
Building Commission NSW / Strata Community Association 2023 Strata Defects Survey: 53% of newly registered strata buildings reported at least one serious defect in common property (39% in the 2021 survey). Defects are common, not exceptional — and new does not mean safe (Opal Tower was under a year old).
Get an independent structural and strata inspection before you commit — the defect base rate makes it the single highest-value dollar in the purchase.
We cannot see inside a building — no one can from public records. This section states base rates and observable adjacency only, and will never call a building safe.
The building — its registered strata scheme
Strata plan SP111010 registered 2026 — the building is at least 0 years old · 2 lots in the scheme (small scheme — levies and decisions shared among few owners).
Registration is an age floor, not a build date — a converted building is older than its strata plan. Scheme records from the NSW Strata Hub. © State of New South Wales (Spatial Services, a business unit of the Department of Customer Service NSW). For current information go to spatial.nsw.gov.au.
School catchments
Vaucluse PS (primary) · Rose Bay SC (secondary)
2 primary schools within 2 km · ICSEA ~1132 — the socio-educational advantage of the school community (My School, national average ~1000): a demographic measure, never a results or quality score.
Suburb-centre approximation for Vaucluse — addresses near a boundary can differ. Verify the exact address at School Finder. Intake zones cover government schools only.
Want the numbers agents don't volunteer?
Check any Sydney suburb free — Market Mint market-conditions readout, live median, clearance trend and the price model — at aipropertyeye.com. No sign-up for the suburb check; the full board is 7 days free.
Data from published auction results (Domain) and live portal listings. Estimates are never valuations or financial advice. Own this home and want a result corrected? hello@aipropertyeye.com.