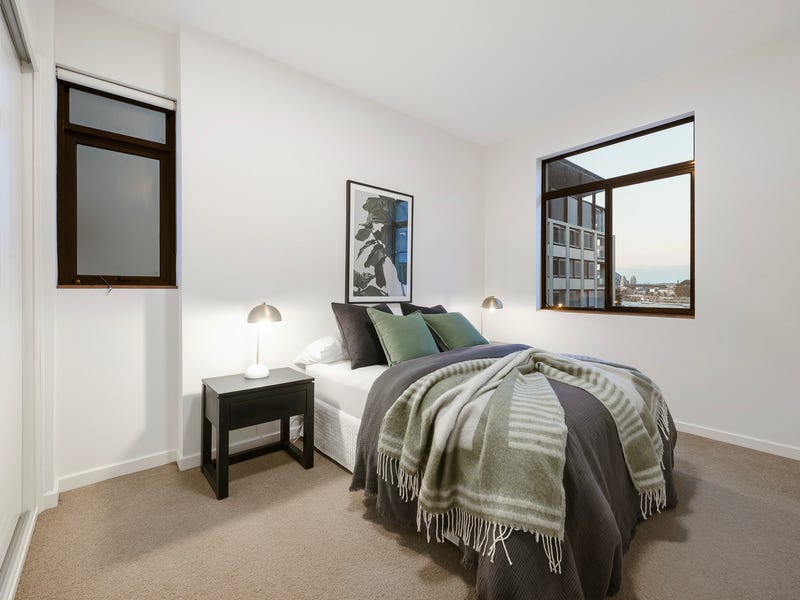
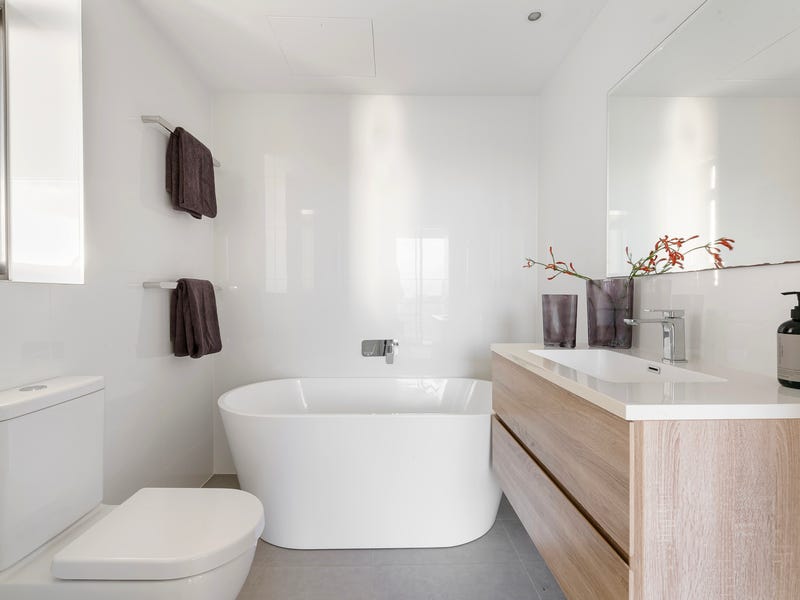
Currently listed — $2,750,000
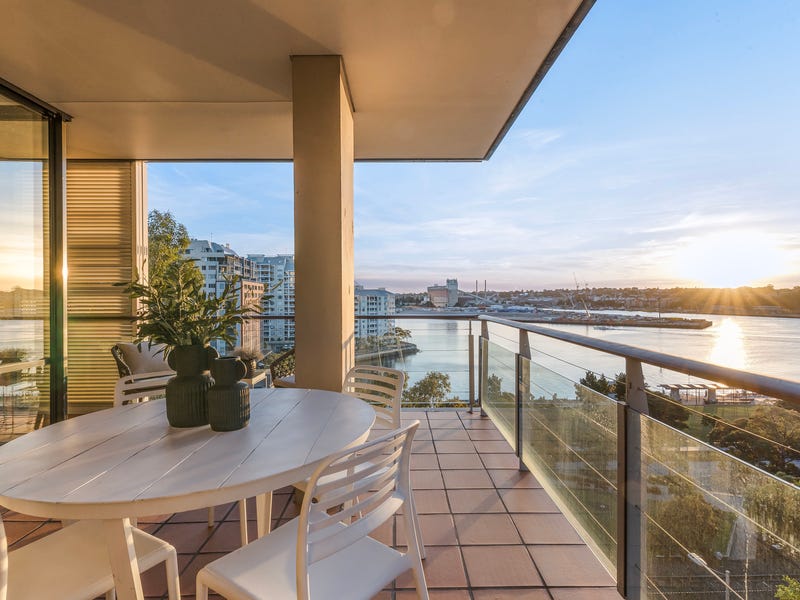
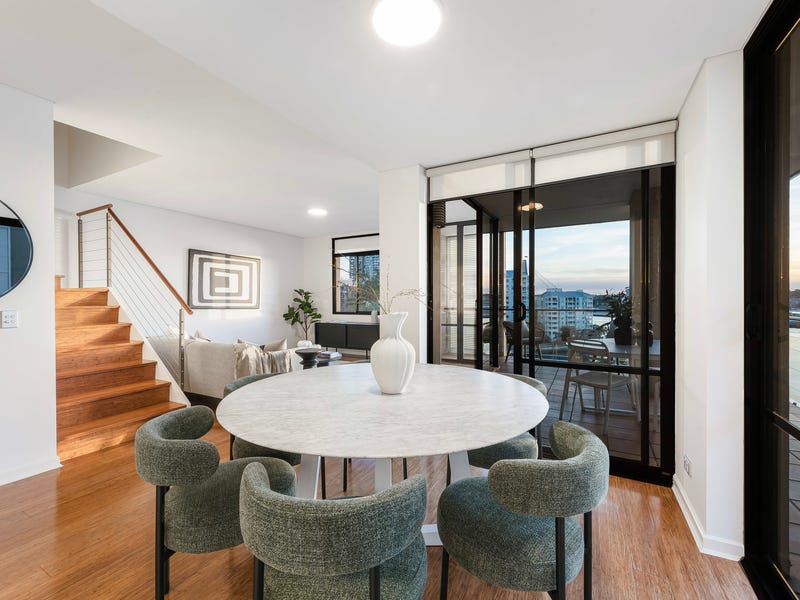
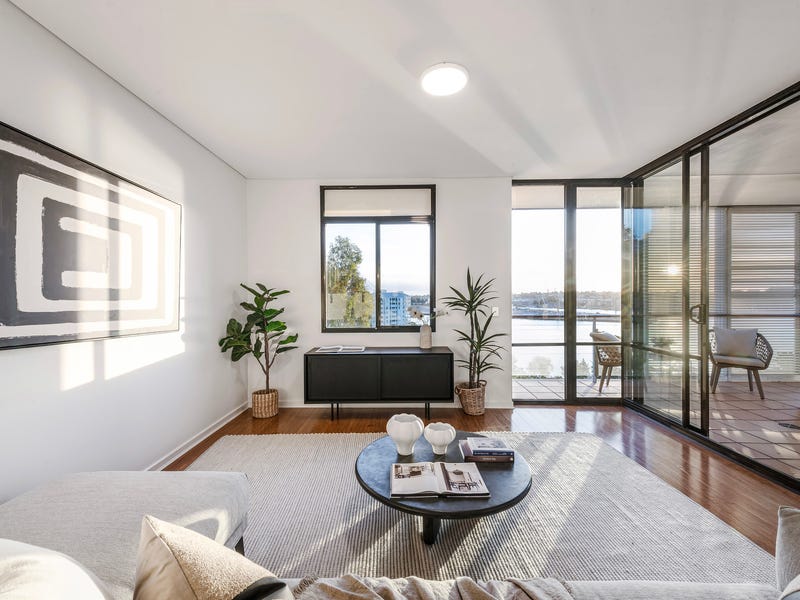
3 bed · 2 bath · 2 car · ApartmentUnitFlat
The Property Brief — what the evidence shows. You draw the conclusion.
What we've tracked
- 14 Aug 2026 our tracking restarted after a six-week portal gap — the campaign start is unknown, this is not a listing date
- 18 Aug 2026 asking $2.75M
Suburb risk flags
crime index: 70 — above sydney average · 18 min walk to Wynyard · ~4 min train to the CBD · light rail ~every 6 min at peak
Where every number comes from
- Evidence trail: tracked by our radar from portal listings, web-archive checks and published auction results — each entry dated
- Risk flags: suburb-level overlays (BOCSAR crime, flood/bushfire intel, aircraft bands, GTFS transit) — NOT a per-parcel assessment
Rent evidence — asking vs transacted, Pyrmont · postcode 2009
$1375–$2100/wk is what 3-bed units in 2009 actually transact for (middle half of 23 bonds lodged, Q2 2026 · median $1550/wk — NSW Fair Trading, CC BY).
2019Q1 → 2026Q2: $750 → $970/wk · +6% over the last 12 months (latest four quarters averaged against the previous four) — quarterly new-tenancy medians for units in 2009, all bedroom counts pooled.
Asking rents are what agents hope for; bond figures are what tenants actually signed at (NSW Fair Trading bond lodgements, CC BY). No yield % is derived here: each rent above is a different grain from this home's price, and a ratio of two grains reads as precision it doesn't have. New-tenancy rents run hotter than sitting rents. Not financial advice.
Growth trend — Pyrmont units at auction
Measured like-for-like growth ≈ 3.9%/yr — 2-bed sold-price medians across 16 quarters (47 sales).
Suburb-level, from published auction results. No single building has enough sales for a block-level series, so this is the honest grain; sales-mix shifts move raw medians, and the measured rate (when shown) controls for bed count.
Similar properties — on the market now
The 6 listings above are on the market now: same unit category, within 1 bedroom of 3, asking within 20% of this one, in Pyrmont or a suburb whose centre is within 3 km — ordered by how close the asking price is. That is the whole rule: a filter, not a recommendation, and nothing here judges which home is better.
Planning & zoning — R1 General Residential
A mix of housing types — houses through to apartments — permitted.
Height limit 30m (≈ 9 storeys) — the current legal ceiling for new building at this point under the LEP. Any proposal above it needs a variation or a rezoning — the kind of change the fast-track pipeline tracks.
Floor space ratio 3.5:1 — the maximum gross floor area you can build is 3.5:1 times the site area.
Strata plan SP67665 — A strata-titled scheme — the parcel area is the WHOLE scheme's land, not this unit's. From the NSW cadastre at this address's geocoded point.
Zone R1 (General Residential) under the SYDNEY LEP, from the NSW ePlanning layers at this address's geocoded point — a guide, not a parcel-level legal check. Confirm the exact lot at the NSW Planning Portal.
Development applications — at & near this address
| Where | Proposal | Status | Outcome | Est. cost | Lodged |
|---|---|---|---|---|---|
| ~69 m · 731/8 Point Street Pyrmont, Nsw 2009 | Balconies, Decks, Patios, Terraces Or Verandahs, Alterations And Additions To Residential Development · 1 new dwelling | Determined | Approved | $696k | 2022-02-03 |
Development application data © NSW Department of Planning and Environment, used under CC BY 4.0. Matched at this exact address or within ~150 m of its geocoded point — proximity evidence, not a parcel-level check. Lodged means proposed, not approved or built. Outcome comes from a separate NSW dataset that stops in Nov 2023: applications determined after that, or still undetermined, read “not on record” — which means we don't know, never that it was refused. “Status” is the council's own workflow state and “Determined” on its own does not say which way it went. Verify any application on the NSW Planning Portal.
Construction risk — what no listing tells you
Building Commission NSW / Strata Community Association 2023 Strata Defects Survey: 53% of newly registered strata buildings reported at least one serious defect in common property (39% in the 2021 survey). Defects are common, not exceptional — and new does not mean safe (Opal Tower was under a year old).
Get an independent structural and strata inspection before you commit — the defect base rate makes it the single highest-value dollar in the purchase.
We cannot see inside a building — no one can from public records. This section states base rates and observable adjacency only, and will never call a building safe.
What's changing in Pyrmont — recent local signals
2025-10-23 — Childcare new — 14-26 WATTLE STREET PYRMONT 2009 ($331337k) (institutional-signals.json (PAN-591913, OnlineDA))
Dated public signals compiled for this suburb — openings, closures, site sales and institutional moves. Facts with sources, not forecasts.
School catchments
Ultimo PS (primary) · SSC Balmain (secondary)
6 primary schools within 2 km · ICSEA ~1102 — the socio-educational advantage of the school community (My School, national average ~1000): a demographic measure, never a results or quality score.
NSW DoE intake zones at this address's geocoded point — tighter than a suburb-level guess, but geocodes carry a few metres of error and boundaries change with reviews. Verify the exact address at School Finder. Intake zones cover government schools only.
Green space nearby
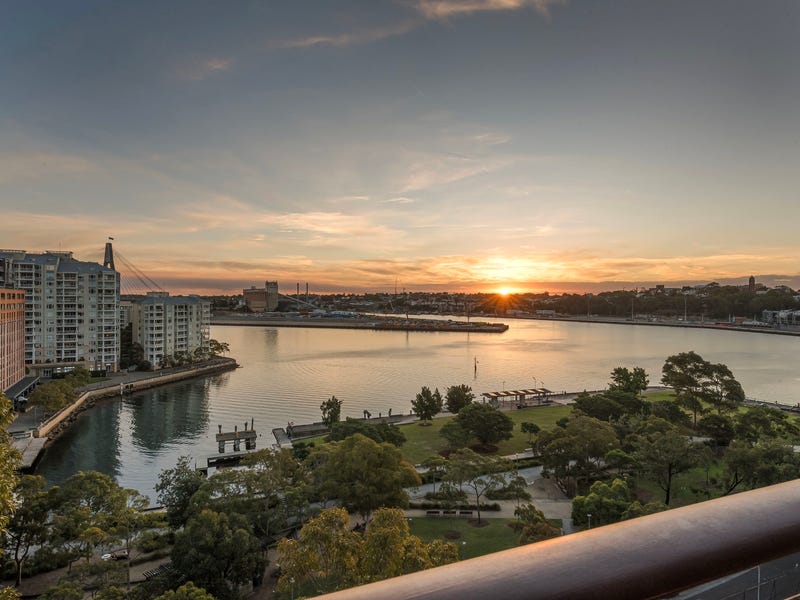
Protected public recreation land within 100 m
Land zoned RE1 under the local environmental plan — reserved for public recreation, which protects it from being built over. The zoning doesn't say what's on it or how usable it is, and this layer doesn't carry park names.
Privately-zoned recreation land (RE2 — typically golf courses or club grounds) within 1000 m. Private land: green outlook, not public open space.
Straight-line distance, not walking distance. NSW ePlanning planning layers (Land Zoning), CC BY. Distances are ladder buckets measured at the address's geocoded point.
Want the numbers agents don't volunteer?
Check any Sydney suburb free — Market Mint market-conditions readout, live median, clearance trend and the price model — at aipropertyeye.com. No sign-up for the suburb check; the full board is 7 days free.
Data from published auction results (Domain) and live portal listings. Estimates are never valuations or financial advice. Own this home and want a result corrected? hello@aipropertyeye.com.