Currently listed
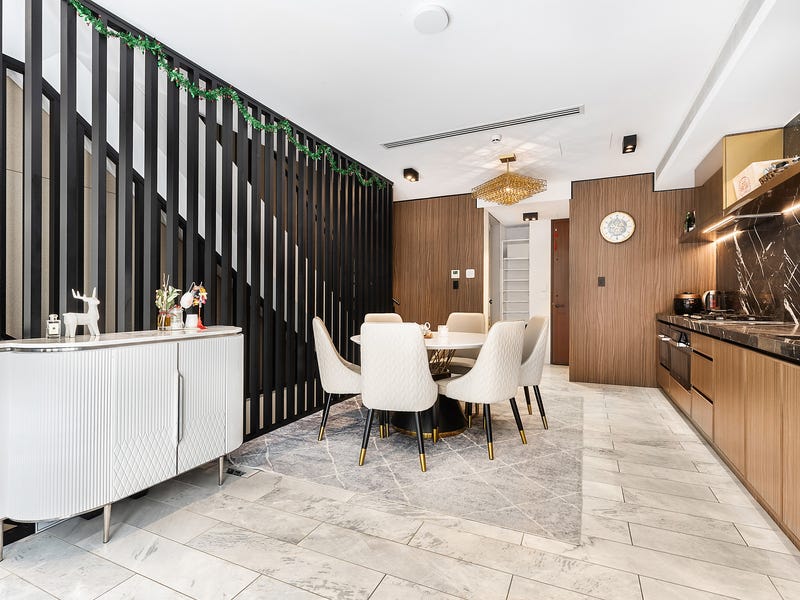
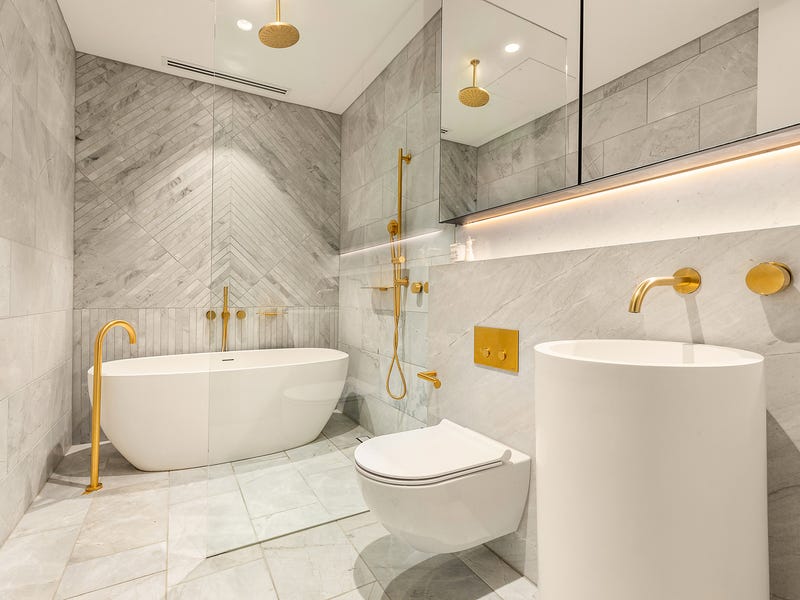
3 bed · 2 bath · 1 car · Townhouse
The Property Brief — what the evidence shows. You draw the conclusion.
What we've tracked
- 24 Aug 2026 first tracked by our radar (the portal doesn't publish its list date)
- 27 Aug 2026 on market 2+ days — first tracked by us, a lower bound
Suburb risk flags
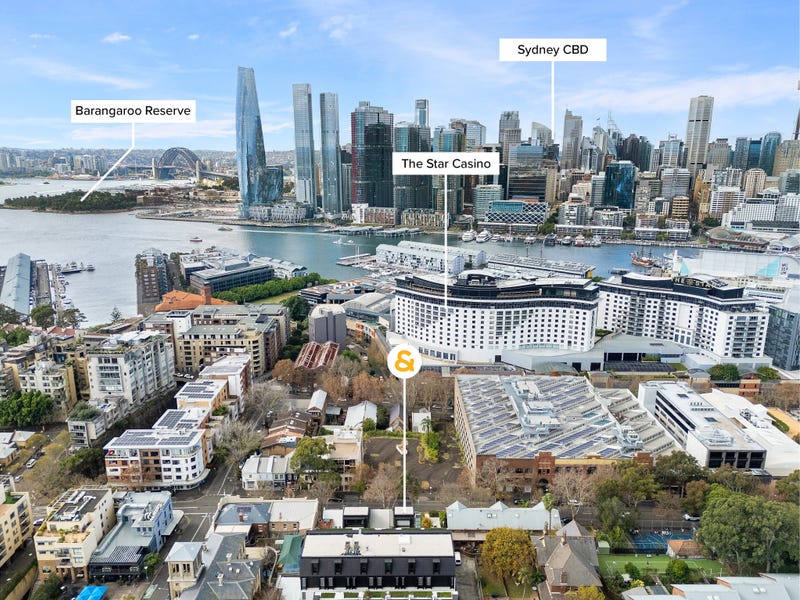
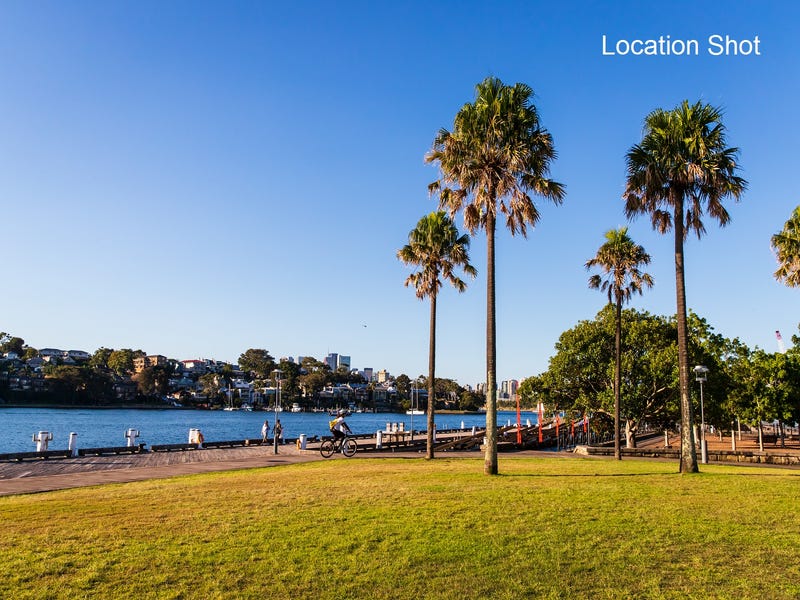
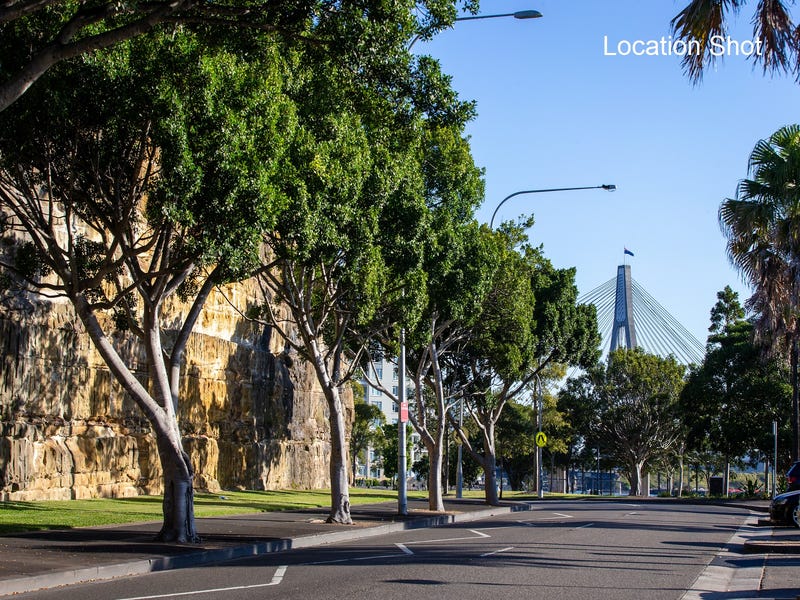
crime index: 70 — above sydney average · 18 min walk to Wynyard · ~4 min train to the CBD · light rail ~every 6 min at peak
Where every number comes from
- Evidence trail: tracked by our radar from portal listings, web-archive checks and published auction results — each entry dated
- Risk flags: suburb-level overlays (BOCSAR crime, flood/bushfire intel, aircraft bands, GTFS transit) — NOT a per-parcel assessment
⏱ Days on market — this campaign
2 days since our daily sweep first saw this listing.
The portal's own campaign may have started slightly earlier than our first sighting. Longer campaigns tend to mean more negotiating room — the board's "Longest listed" sort exists for exactly that reason.
Development potential — how Council of the City of Sydney treats the work you might do
Refuses 2.61% of the development applications it decides · off-street parking 3.08% (determinations to Nov 2023).
The full outlook — every category with confidence ranges, which plan elements come unstuck, and the heritage effect by category — is under Explore the area.
Sale history — the official settled-sale record at this address
| Exchanged | Price | Change since prior sale |
|---|---|---|
| 16 Sept 2015 | $23,290,000 | — |
Settled-sale records from the NSW Valuer General's Property Sales Information. Dates are contract (exchange) dates; sales appear only once lodged, so the most recent months are incomplete and revise upward — never read the latest month as final. Two entries on one date are usually a single transaction recorded across parts. © State of New South Wales (Valuation NSW).
Planning & zoning — MU1 Mixed Use
Shops/offices below, apartments above. Walkable and lively, but denser and busier.
Zone MU1 (Mixed Use) under the SYDNEY LEP, from the NSW ePlanning layers at this address's geocoded point — a guide, not a parcel-level legal check. Confirm the exact lot at the NSW Planning Portal.
Development outlook — how often Council of the City of Sydney has refused this kind of work
| If you wanted to… | Refused | vs NSW | Applications decided |
|---|---|---|---|
| Alterations & additions | 1.93% (1.34–2.78%) | 0.7× (NSW 2.63%) | 28 refused of 1,450 · 13 approved with conditions |
| Off-street parking | 3.08% (0.85–10.54%) | 1.2× (NSW 2.58%) | 2 refused of 65 · 1 approved with conditions |
| Pool, deck or fence | 3.41% (1.57–7.24%) | 2× (NSW 1.73%) | 6 refused of 176 |
| Granny flat | 3.13% (0.55–15.74%) | 0.7× (NSW 4.45%) | 1 refused of 32 · 1 approved with conditions |
| Knock down & rebuild | 5.63% (2.88–10.72%) | 0.5× (NSW 11.55%) | 8 refused of 142 · 4 approved with conditions |
Across all application types Council of the City of Sydney refused 2.61% (2.08–3.26%) of the 2,839 development applications it decided.
Where these applications come unstuck
The refusal rate above says how strict the council is. This says which part of a plan is exposed — measured across all 192,284 NSW development applications, not just this council. Each is an association: plenty of applications carrying these elements are approved, and nothing here is a verdict on a proposal you haven't made yet.
- Alterations & additions — a new vehicle crossing cut into the front boundary (refused 7.27% vs 2.59% for this kind of work generally — 2.8×, on 220 applications); excavation or a new lower level (refused 6.71% vs 2.54% for this kind of work generally — 2.64×, on 611 applications)
- Off-street parking — a new vehicle crossing cut into the front boundary (refused 8.45% vs 2.42% for this kind of work generally — 3.49×, on 284 applications)
- Pool, deck or fence — excavation or a new lower level (refused 6.22% vs 1.61% for this kind of work generally — 3.88×, on 659 applications); full demolition and rebuild (refused 4.97% vs 1.6% for this kind of work generally — 3.12×, on 965 applications)
- Knock down & rebuild — excavation or a new lower level (refused 25.78% vs 9.36% for this kind of work generally — 2.75×, on 256 applications); full demolition and rebuild (refused 19.91% vs 10.46% for this kind of work generally — 1.9×, on 221 applications)
Determinations lodged on the NSW Planning Portal up to Nov 2023 — the published dataset stops there, so this is a record of how the council has behaved, not a forecast and not a statement about any particular application. Rates cover development applications only; modifications and reviews of an earlier decision are excluded. A rate is shown only where at least 30 applications were decided — below that the counts are given instead, because a percentage from a handful of decisions is not a fact about a council. "Approved with conditions" is a consent, not a refusal, and is never counted as one.
Development applications — at & near this address
| Where | Proposal | Status | Outcome | Est. cost | Lodged |
|---|---|---|---|---|---|
| ~49 m · 100 Harris Street Pyrmont 2009 | Commercial Development, Alterations Or Additions To An Existing Building Or Structure | Determined | not on record | $2.21M | 2025-11-24 |
| ~49 m · 100 Harris Street Pyrmont 2009 | Office Premise, Alterations Or Additions To An Existing Building Or Structure | Determined | not on record | $5.5M | 2026-03-05 |
| ~49 m · 100 Harris Street Pyrmont 2009 | Office Premise, Alterations Or Additions To An Existing Building Or Structure | Determined | not on record | $3M | 2026-03-09 |
| ~112 m · 78 Harris Street Pyrmont 2009 | Business Premises, Advertising And Signage, Alterations Or Additions To An Existing Building Or Structure | Determined | not on record | $200k | 2025-11-19 |
| ~120 m · 79a John Street Pyrmont 2009 | Other · 1 new dwelling | Determined | Approved | $4.52M | 2021-08-27 |
| ~136 m · 29 Pyrmont Street Pyrmont 2009 | Hotel Or Motel Accommodation, Alterations Or Additions To An Existing Building Or Structure | Deferred Commencement | not on record | $1.81M | 2024-03-12 |
Development application data © NSW Department of Planning and Environment, used under CC BY 4.0. Matched at this exact address or within ~150 m of its geocoded point — proximity evidence, not a parcel-level check. Lodged means proposed, not approved or built. Outcome comes from a separate NSW dataset that stops in Nov 2023: applications determined after that, or still undetermined, read “not on record” — which means we don't know, never that it was refused. “Status” is the council's own workflow state and “Determined” on its own does not say which way it went. Verify any application on the NSW Planning Portal.
What's changing in Pyrmont — recent local signals
2025-10-23 — Childcare new — 14-26 WATTLE STREET PYRMONT 2009 ($331337k) (institutional-signals.json (PAN-591913, OnlineDA))
Dated public signals compiled for this suburb — openings, closures, site sales and institutional moves. Facts with sources, not forecasts.
School catchments
Ultimo PS (primary) · SSC Balmain (secondary)
6 primary schools within 2 km · ICSEA ~1102 — the socio-educational advantage of the school community (My School, national average ~1000): a demographic measure, never a results or quality score.
NSW DoE intake zones at this address's geocoded point — tighter than a suburb-level guess, but geocodes carry a few metres of error and boundaries change with reviews. Verify the exact address at School Finder. Intake zones cover government schools only.
Green space nearby
Protected public recreation land within 100 m
Land zoned RE1 under the local environmental plan — reserved for public recreation, which protects it from being built over. The zoning doesn't say what's on it or how usable it is, and this layer doesn't carry park names.
Privately-zoned recreation land (RE2 — typically golf courses or club grounds) within 2000 m. Private land: green outlook, not public open space.
Straight-line distance, not walking distance. NSW ePlanning planning layers (Land Zoning), CC BY. Distances are ladder buckets measured at the address's geocoded point.
Want the numbers agents don't volunteer?
Check any Sydney suburb free — Market Mint market-conditions readout, live median, clearance trend and the price model — at aipropertyeye.com. No sign-up for the suburb check; the full board is 7 days free.
Data from published auction results (Domain) and live portal listings. Estimates are never valuations or financial advice. Own this home and want a result corrected? hello@aipropertyeye.com.