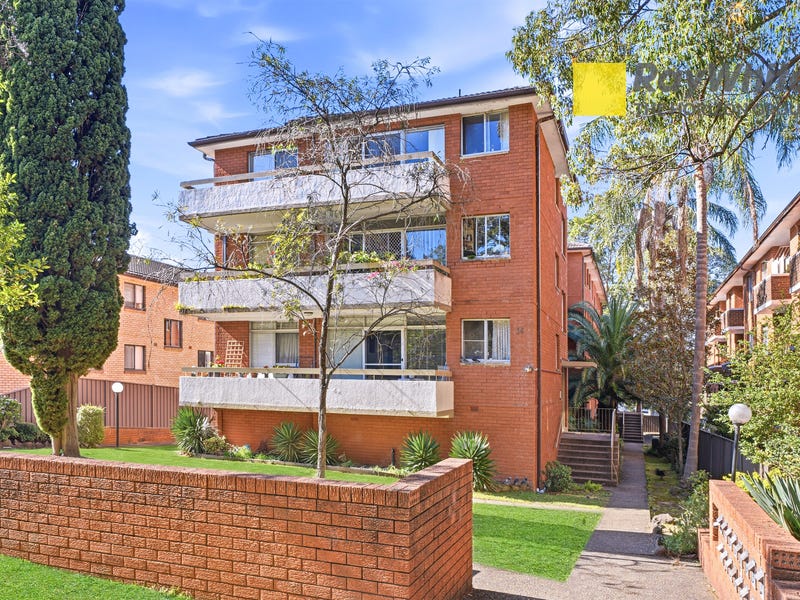
Currently listed
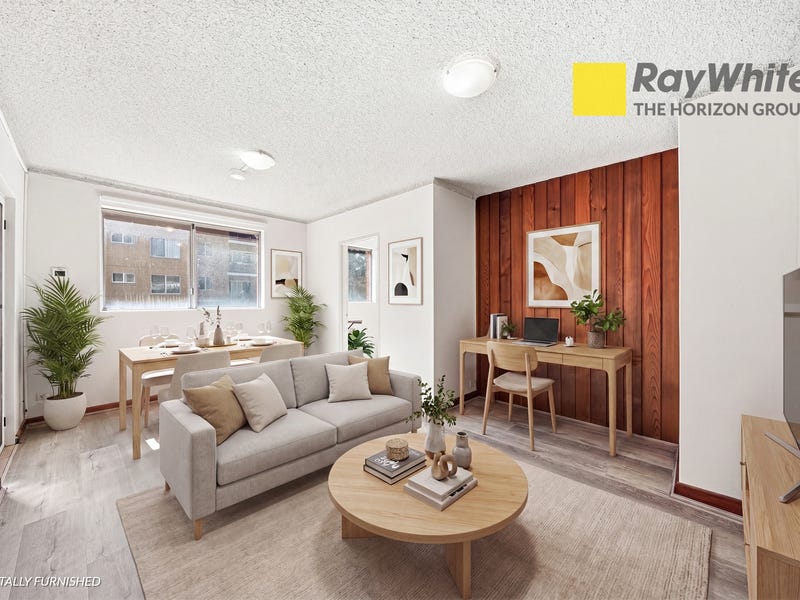
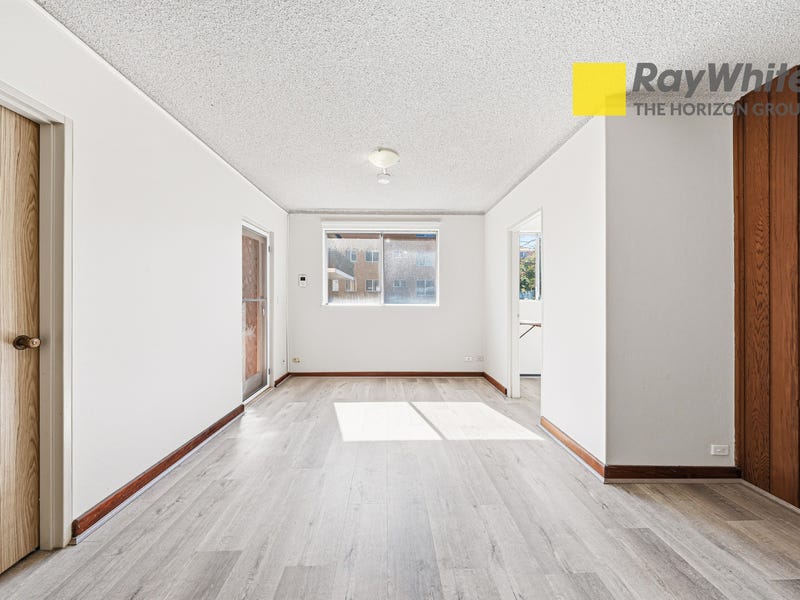
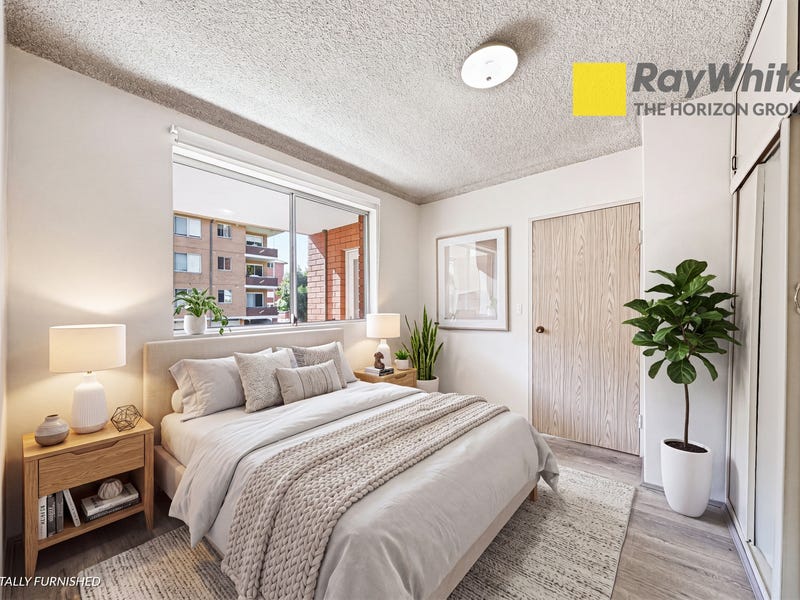
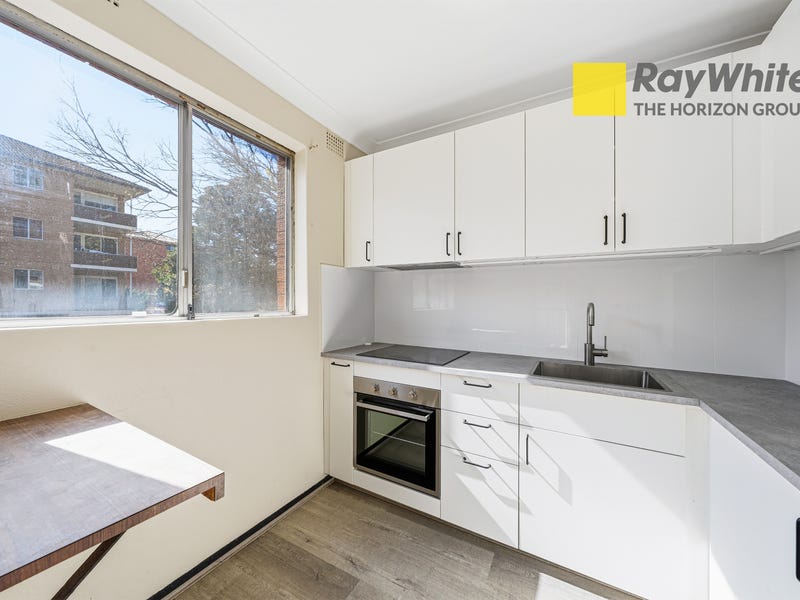
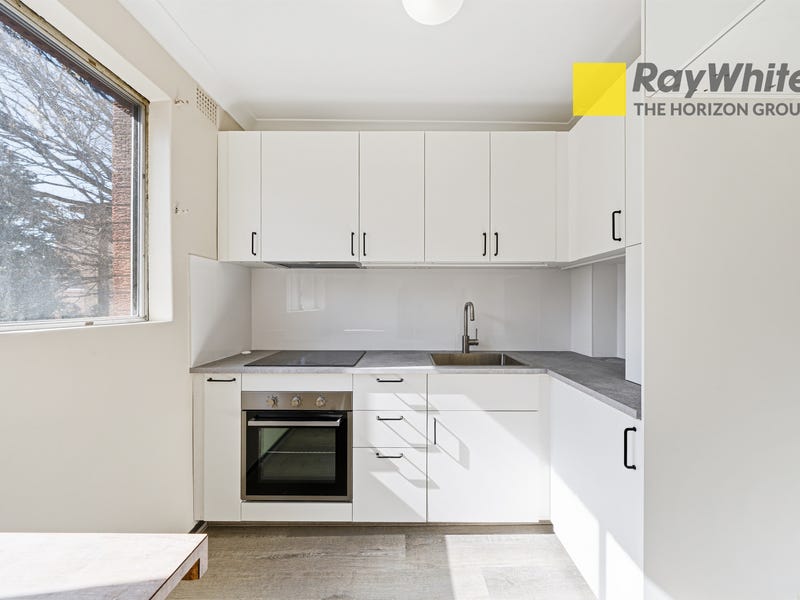
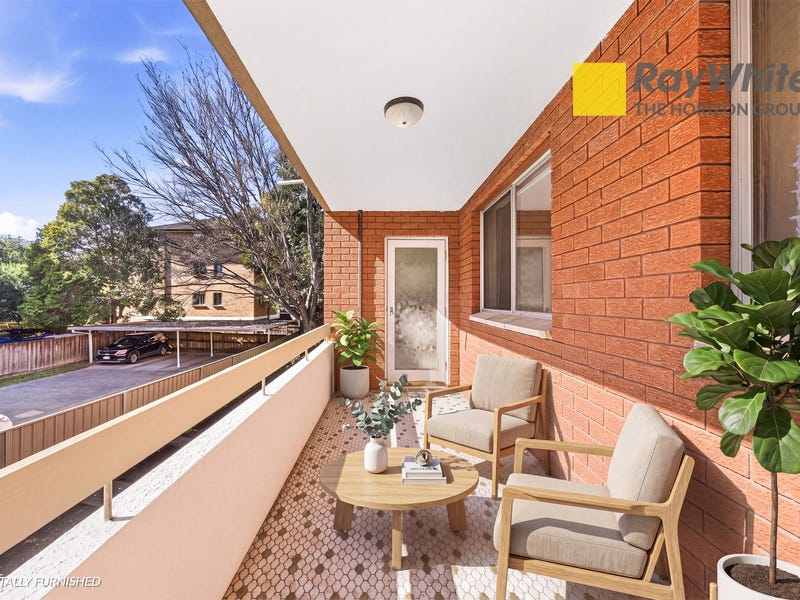
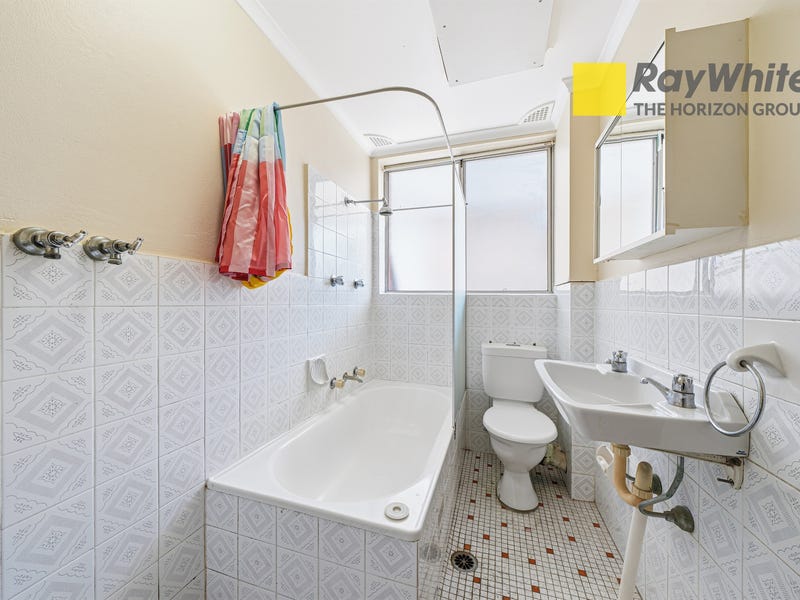
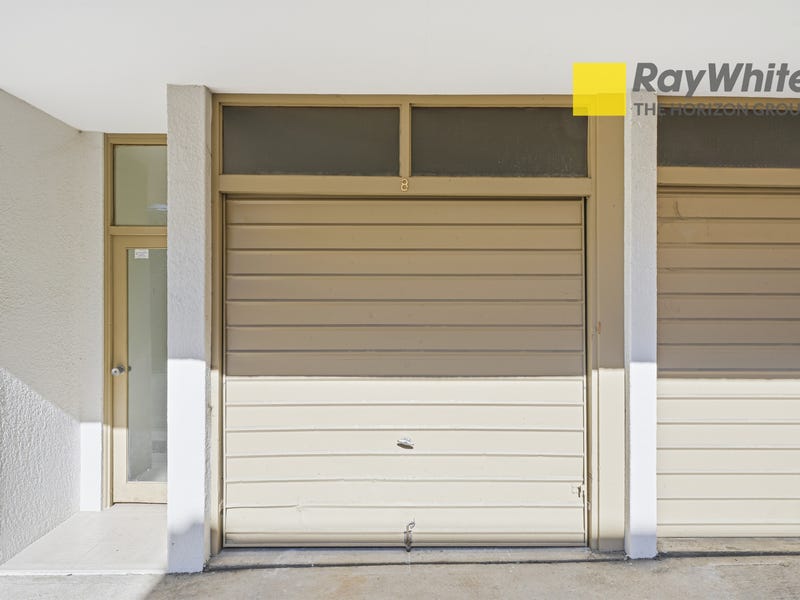
1 bed · 1 bath · 1 car · ApartmentUnitFlat
The Property Brief — what the evidence shows. You draw the conclusion.
What we've tracked
- 26 Aug 2026 listed by the agency (portal date)
- 28 Aug 2026 on market 2 days — portal listing date
Suburb risk flags
crime index: 37 — below sydney average · 1 min walk to West Ryde · ~22 min train to the CBD · trains ~every 8 min at peak
Where every number comes from
- Evidence trail: tracked by our radar from portal listings, web-archive checks and published auction results — each entry dated
- Risk flags: suburb-level overlays (BOCSAR crime, flood/bushfire intel, aircraft bands, GTFS transit) — NOT a per-parcel assessment
⏱ Days on market — this campaign
2 days since our daily sweep first saw this listing.
The portal's own campaign may have started slightly earlier than our first sighting. Longer campaigns tend to mean more negotiating room — the board's "Longest listed" sort exists for exactly that reason.
Rent evidence — asking vs transacted, West Ryde · postcode 2114
$525–$700/wk is what 1-bed units in 2114 actually transact for (middle half of 99 bonds lodged, Q2 2026 · median $640/wk — NSW Fair Trading, CC BY).
2019Q1 → 2026Q2: $460 → $675/wk · +7% over the last 12 months (latest four quarters averaged against the previous four) — quarterly new-tenancy medians for units in 2114, all bedroom counts pooled.
Asking rents are what agents hope for; bond figures are what tenants actually signed at (NSW Fair Trading bond lodgements, CC BY). No yield % is derived here: each rent above is a different grain from this home's price, and a ratio of two grains reads as precision it doesn't have. New-tenancy rents run hotter than sitting rents. Not financial advice.
Growth trend — West Ryde units at auction
Not enough West Ryde unit auctions on record to show a trend — this fills in as the archive grows.
Suburb-level, from published auction results. No single building has enough sales for a block-level series, so this is the honest grain; sales-mix shifts move raw medians, and the measured rate (when shown) controls for bed count.
Construction risk — what no listing tells you
Building Commission NSW / Strata Community Association 2023 Strata Defects Survey: 53% of newly registered strata buildings reported at least one serious defect in common property (39% in the 2021 survey). Defects are common, not exceptional — and new does not mean safe (Opal Tower was under a year old).
Get an independent structural and strata inspection before you commit — the defect base rate makes it the single highest-value dollar in the purchase.
We cannot see inside a building — no one can from public records. This section states base rates and observable adjacency only, and will never call a building safe.
The building — its registered strata scheme
Strata plan SP5841 registered 1971 — the building is at least 55 years old · 15 lots in the scheme.
Registration is an age floor, not a build date — a converted building is older than its strata plan. Scheme records from the NSW Strata Hub. © State of New South Wales (Spatial Services, a business unit of the Department of Customer Service NSW). For current information go to spatial.nsw.gov.au.
School catchments
West Ryde PS (primary) · Riverside GHS (secondary)
7 primary schools within 2 km · ICSEA ~1078 — the socio-educational advantage of the school community (My School, national average ~1000): a demographic measure, never a results or quality score.
Suburb-centre approximation for West Ryde — addresses near a boundary can differ. Verify the exact address at School Finder. Intake zones cover government schools only.
Want the numbers agents don't volunteer?
Check any Sydney suburb free — Market Mint market-conditions readout, live median, clearance trend and the price model — at aipropertyeye.com. No sign-up for the suburb check; the full board is 7 days free.
Data from published auction results (Domain) and live portal listings. Estimates are never valuations or financial advice. Own this home and want a result corrected? hello@aipropertyeye.com.