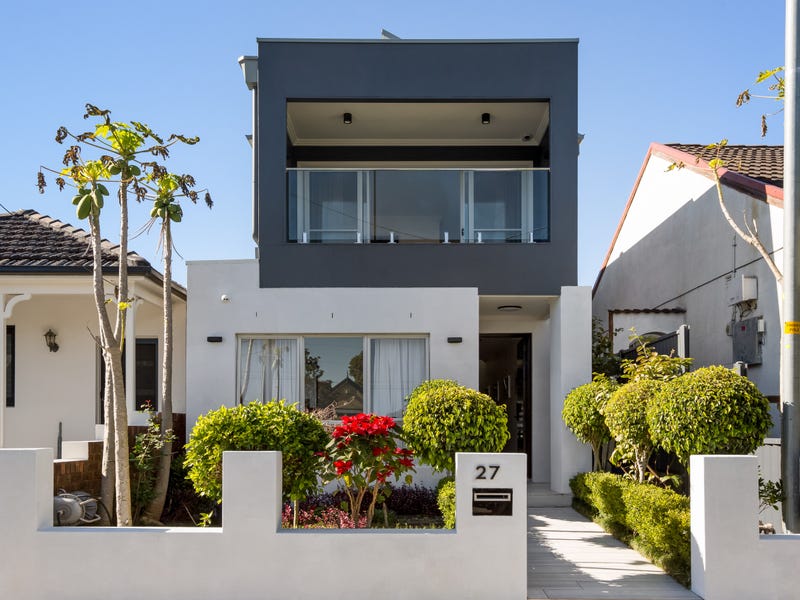
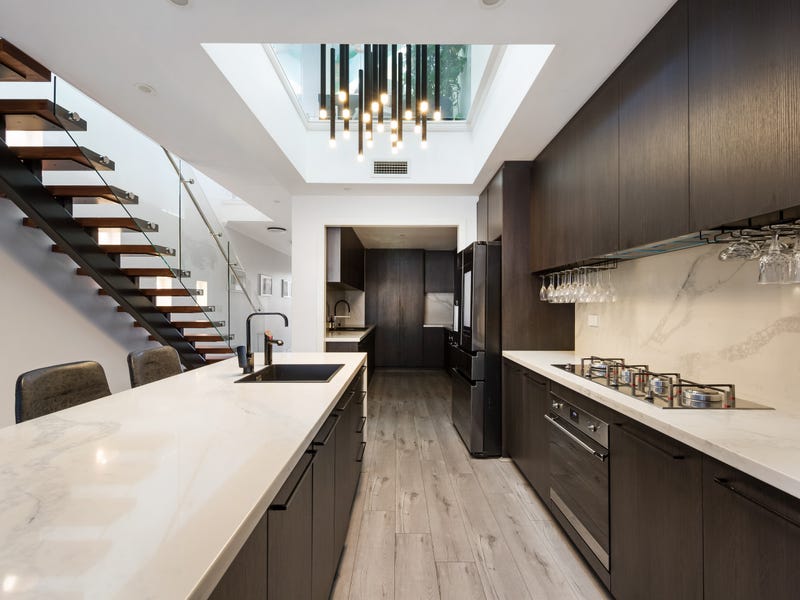
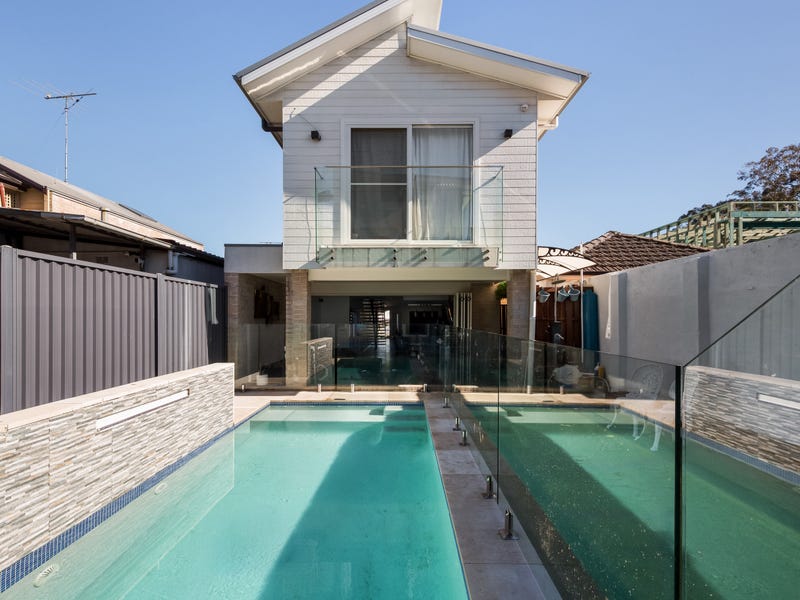
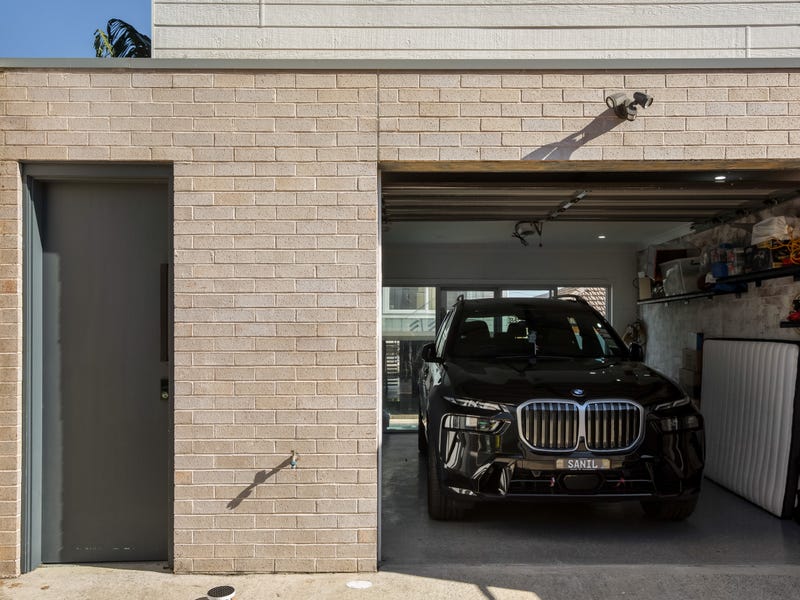
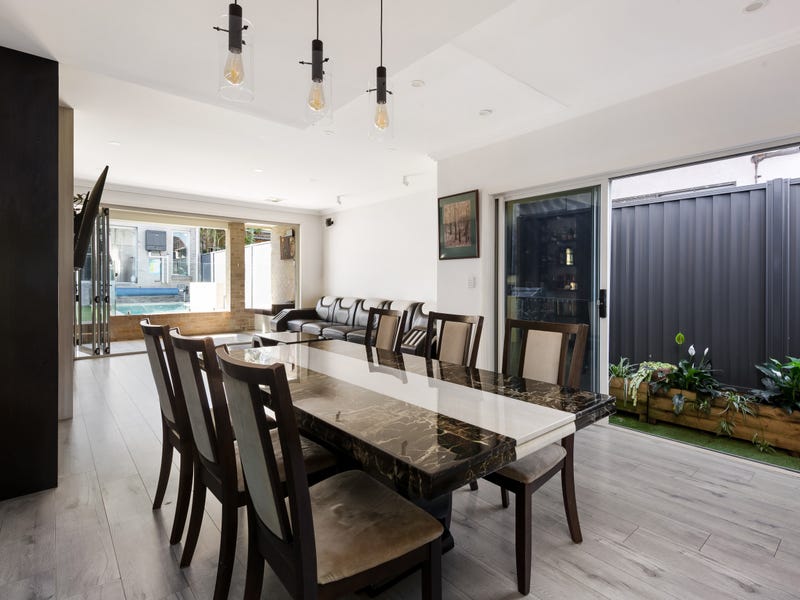
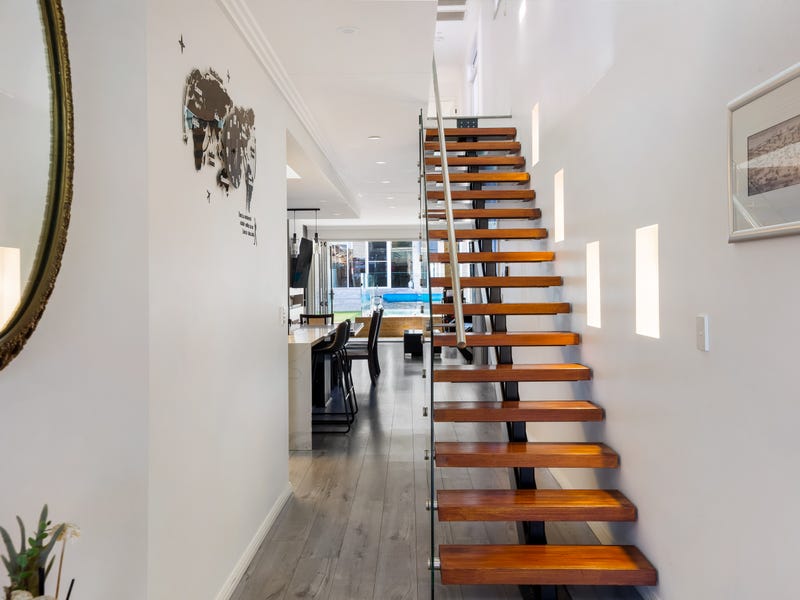
Currently listed — $2,800,000
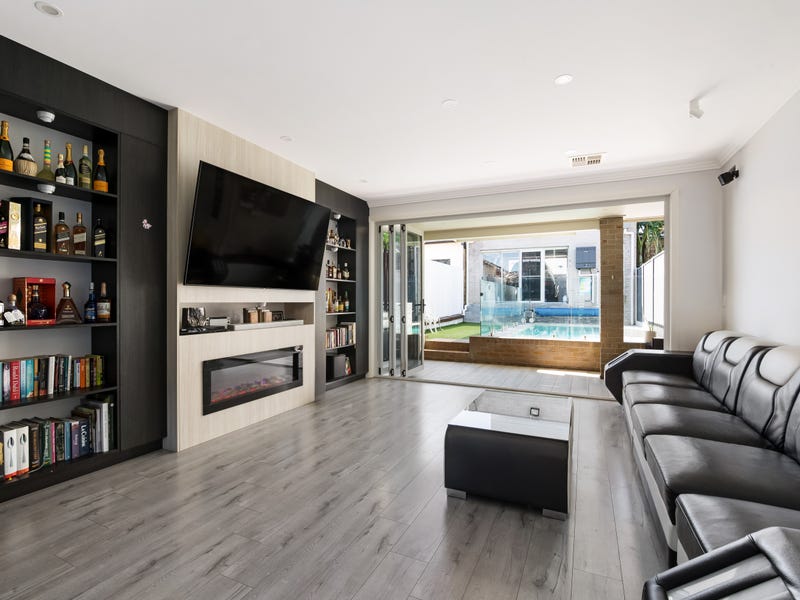
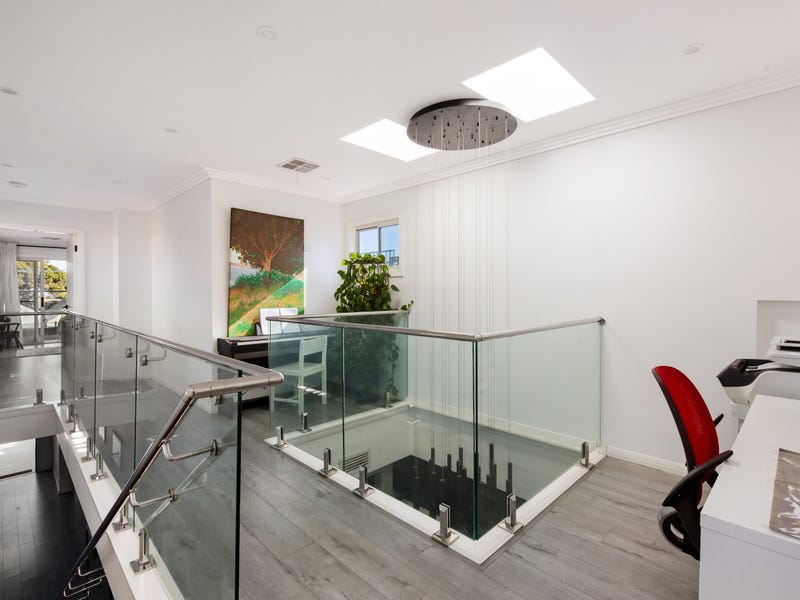
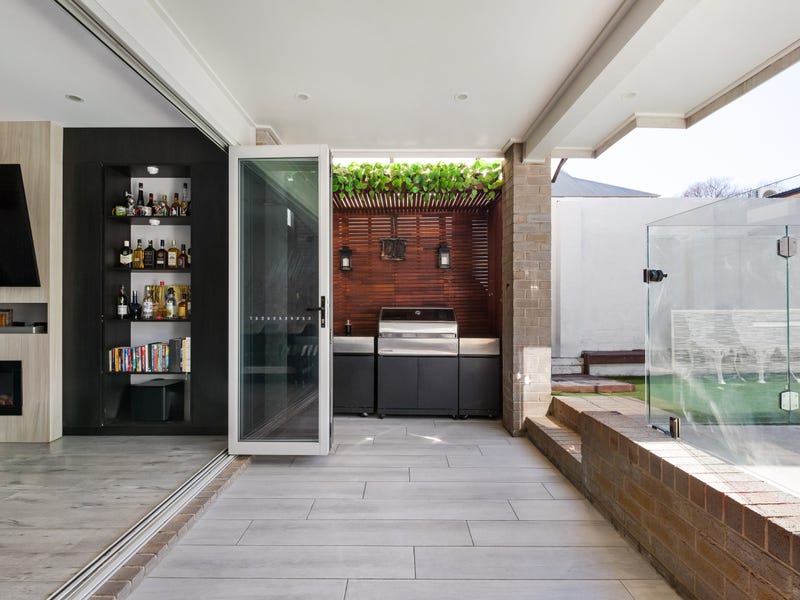
5 bed · 4 bath · 1 car · House · 287 m² land
The Property Brief — what the evidence shows. You draw the conclusion.
Confidence: Low — based on 181 comparable auction sales (1 of this exact configuration) · model runs ±20% for this configuration · confidence held at Low — under 20 same-configuration sales · adjusted for this block's land size · thin comparable support for this configuration — read the range as wider, not as a warning · the model's typical miss is ~11% against published results — every hit and miss
What we've tracked
- 14 Aug 2026 our tracking restarted after a six-week portal gap — the campaign start is unknown, this is not a listing date
- 19 Aug 2026 asking $2.8M
Comparable auction sales
| Address | Config | Sold | When |
|---|---|---|---|
| 82 Francis St | 5 bd · 3 ba | $4M | Sept 2025 |
Suburb risk flags
crime index: 52 — around sydney average · 9 min walk to Leichhardt North Light Rail · ~25 min light rail to the CBD · light rail ~every 6 min at peak
Where every number comes from
- Fair value: AI PropertyEye price model 2026-08-11-v5 — trained on 146,492 published auction sales; configuration-level (suburb × type × beds), not an appraisal of this exact home
- Comps: published Domain auction results for Leichhardt — suburb × configuration matches, not hyper-matched to this address
- Evidence trail: tracked by our radar from portal listings, web-archive checks and published auction results — each entry dated
- Risk flags: suburb-level overlays (BOCSAR crime, flood/bushfire intel, aircraft bands, GTFS transit) — NOT a per-parcel assessment
Rent evidence — asking vs transacted, Leichhardt · postcode 2040
$1110/week median new-tenancy rent for houses in 2040 (2026Q2, 94 bonds lodged — all bedroom counts pooled).
2019Q1 → 2026Q2: $800 → $1110/wk · 0% over the last 12 months (latest four quarters averaged against the previous four) — quarterly new-tenancy medians for houses in 2040, all bedroom counts pooled.
Asking rents are what agents hope for; bond figures are what tenants actually signed at (NSW Fair Trading bond lodgements, CC BY). No yield % is derived here: each rent above is a different grain from this home's price, and a ratio of two grains reads as precision it doesn't have. New-tenancy rents run hotter than sitting rents. Not financial advice.
Land — for a house, the land is the asset
287 m²
A house's size is its land. An apartment's advertised "size" can include car space and balcony — the two are never comparable and this site never pools them. Lot details and planning controls sit under Explore the area.
Development potential — how Inner West Council treats the work you might do
Refuses 7.24% of the development applications it decides · off-street parking 10.98% (determinations to Nov 2023).
The full outlook — every category with confidence ranges, which plan elements come unstuck, and the heritage effect by category — is under Explore the area.
Agencies' own published sales nearby — Leichhardt, around 5 beds
| Address | Sold | Price | Beds | Agency |
|---|---|---|---|---|
| 13 North Avenue | 19 Mar 2026 | $2,400,000 | 4 | Harris Partners |
| 48 Renwick Street | 28 June 2025 | $1,700,000 | 4 | Harris Partners |
| 5 Loftus Street | 4 Dec 2021 | $3,100,000 | 6 | Harris Partners |
| 4/14 McDonald Street | 16 Nov 2021 | $1,800,000 | 4 | Harris Partners |
Prices as published on the selling agency's own website (their sold pages) — includes private-treaty sales the auction results never see. Only sales the agency chose to publish a figure for appear here.
Similar properties — on the market now
The 6 listings above are on the market now: same house category, within 1 bedroom of 5, asking within 20% of this one, in Leichhardt or a suburb whose centre is within 3 km — ordered by how close the asking price is. That is the whole rule: a filter, not a recommendation, and nothing here judges which home is better.
Planning & zoning — E4 General Industrial
Industrial land — not a residential setting.
Zone E4 (General Industrial) under the INNER WEST LEP, from the NSW ePlanning layers at this address's geocoded point — a guide, not a parcel-level legal check. Confirm the exact lot at the NSW Planning Portal.
Development outlook — how often Inner West Council has refused this kind of work
| If you wanted to… | Refused | vs NSW | Applications decided |
|---|---|---|---|
| Alterations & additions | 4.67% (3.73–5.83%) | 1.8× (NSW 2.63%) | 73 refused of 1,564 · 65 approved with conditions |
| Off-street parking | 10.98% (7.14–16.52%) | 4.3× (NSW 2.58%) | 19 refused of 173 · 12 approved with conditions |
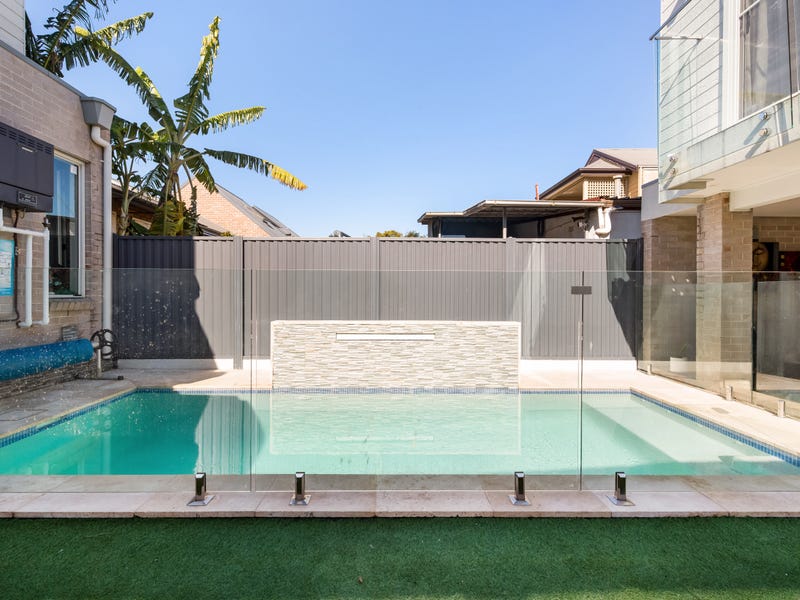
| Pool, deck or fence | 3.95% (2.37–6.53%) | 2.3× (NSW 1.73%) | 14 refused of 354 · 12 approved with conditions |
| Granny flat | 12.68% (6.81–22.37%) | 2.8× (NSW 4.45%) | 9 refused of 71 · 2 approved with conditions |
| Knock down & rebuild | 17.24% (12.67–23.03%) | 1.5× (NSW 11.55%) | 35 refused of 203 · 11 approved with conditions |
Across all application types Inner West Council refused 7.24% (6.3–8.31%) of the 2,555 development applications it decided.
Where these applications come unstuck
The refusal rate above says how strict the council is. This says which part of a plan is exposed — measured across all 192,284 NSW development applications, not just this council. Each is an association: plenty of applications carrying these elements are approved, and nothing here is a verdict on a proposal you haven't made yet.
- Alterations & additions — a new vehicle crossing cut into the front boundary (refused 7.27% vs 2.59% for this kind of work generally — 2.8×, on 220 applications); excavation or a new lower level (refused 6.71% vs 2.54% for this kind of work generally — 2.64×, on 611 applications)
- Off-street parking — a new vehicle crossing cut into the front boundary (refused 8.45% vs 2.42% for this kind of work generally — 3.49×, on 284 applications)
- Pool, deck or fence — excavation or a new lower level (refused 6.22% vs 1.61% for this kind of work generally — 3.88×, on 659 applications); full demolition and rebuild (refused 4.97% vs 1.6% for this kind of work generally — 3.12×, on 965 applications)
- Knock down & rebuild — excavation or a new lower level (refused 25.78% vs 9.36% for this kind of work generally — 2.75×, on 256 applications); full demolition and rebuild (refused 19.91% vs 10.46% for this kind of work generally — 1.9×, on 221 applications)
Determinations lodged on the NSW Planning Portal up to Nov 2023 — the published dataset stops there, so this is a record of how the council has behaved, not a forecast and not a statement about any particular application. Rates cover development applications only; modifications and reviews of an earlier decision are excluded. A rate is shown only where at least 30 applications were decided — below that the counts are given instead, because a percentage from a handful of decisions is not a fact about a council. "Approved with conditions" is a consent, not a refusal, and is never counted as one.
School catchments
Leichhardt PS (primary) · SSC Blackwattle Bay (secondary)
10 primary schools within 2 km · ICSEA ~1122 — the socio-educational advantage of the school community (My School, national average ~1000): a demographic measure, never a results or quality score.
Suburb-centre approximation for Leichhardt — addresses near a boundary can differ. Verify the exact address at School Finder. Intake zones cover government schools only.
Want the numbers agents don't volunteer?
Check any Sydney suburb free — Market Mint market-conditions readout, live median, clearance trend and the price model — at aipropertyeye.com. No sign-up for the suburb check; the full board is 7 days free.
Data from published auction results (Domain) and live portal listings. Estimates are never valuations or financial advice. Own this home and want a result corrected? hello@aipropertyeye.com.