The listing we observed
3 bedrooms · ApartmentUnitFlat
Listing details describe the advertised home. They do not verify its condition or approved use.
Stone Real Estate - Beecroft / Castle Hill / Epping · last observed 24 Oct 2026Camperdown suburb intelligence · all Sydney suburbs · building dossier
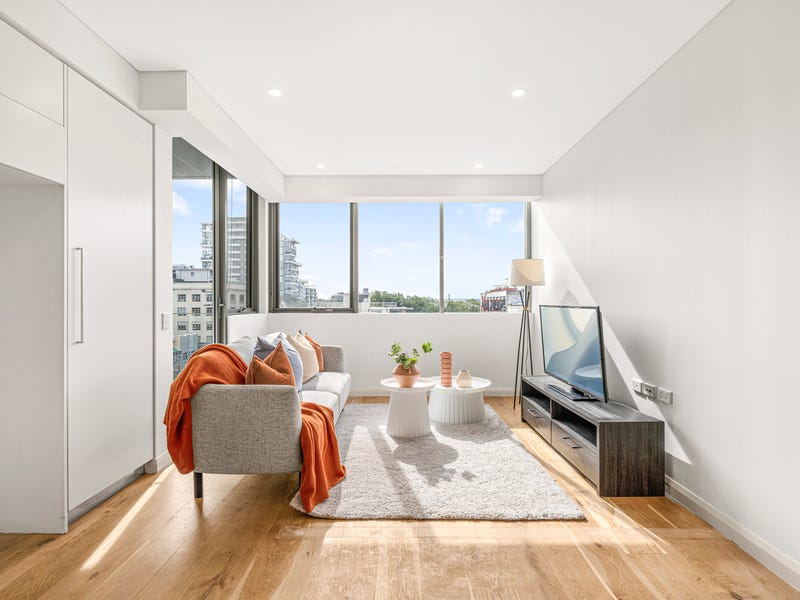
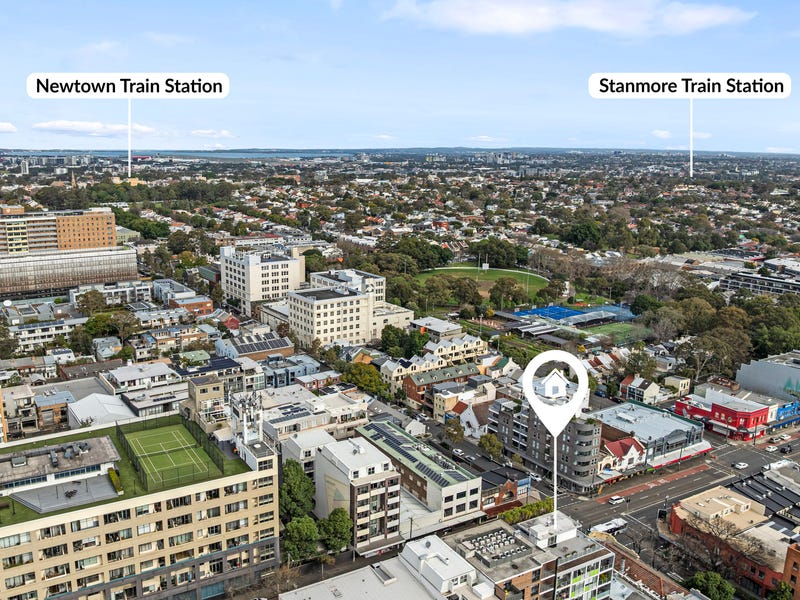
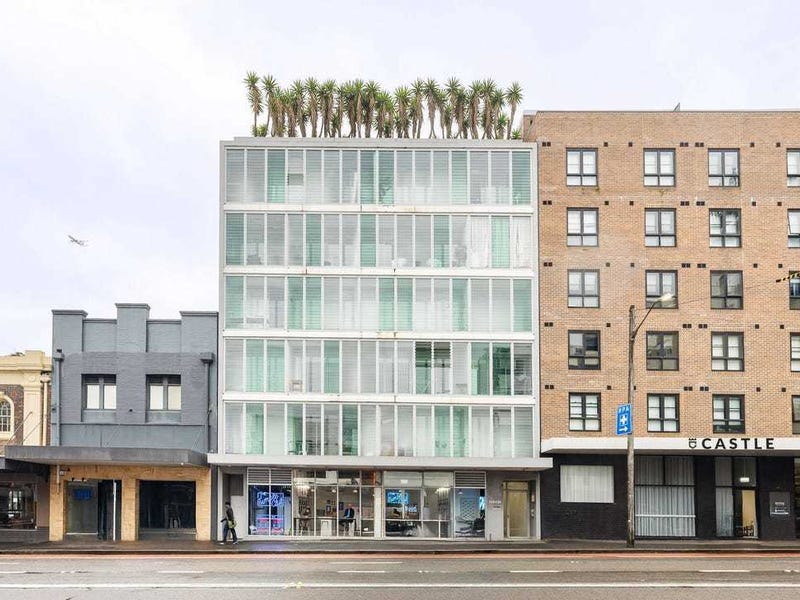
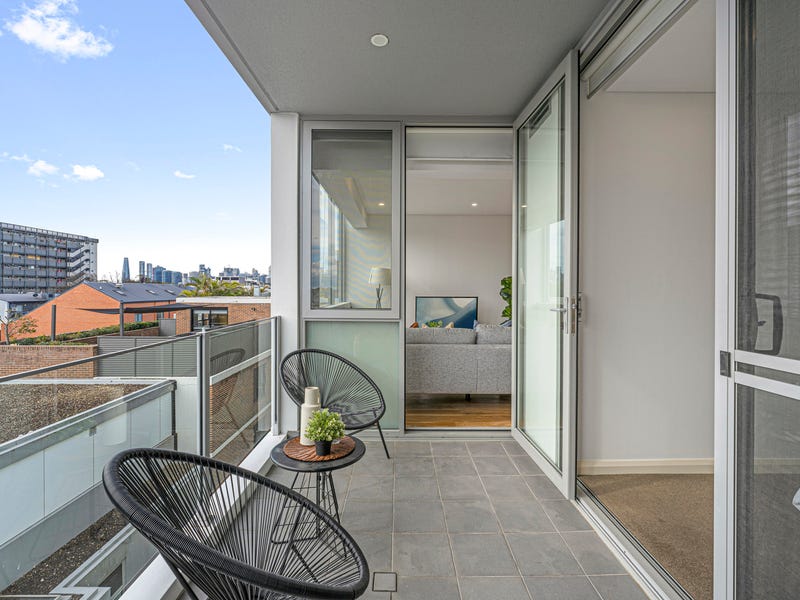
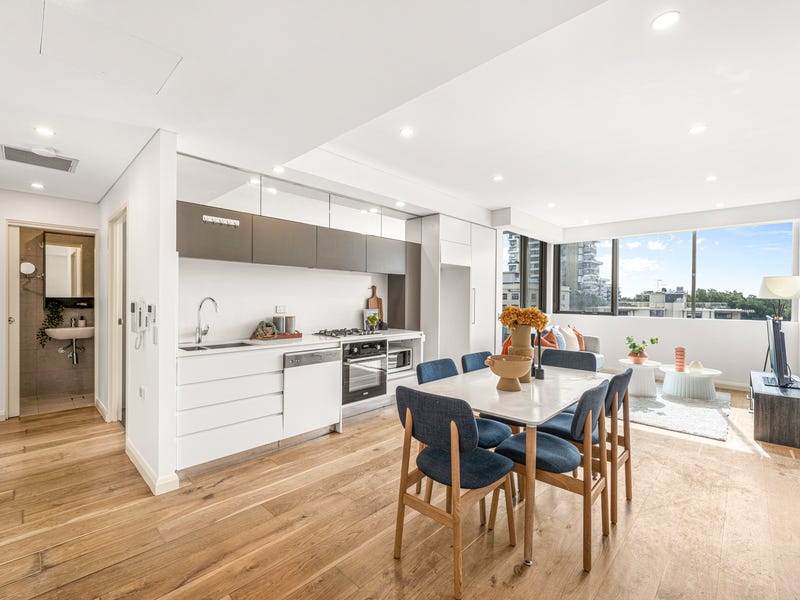
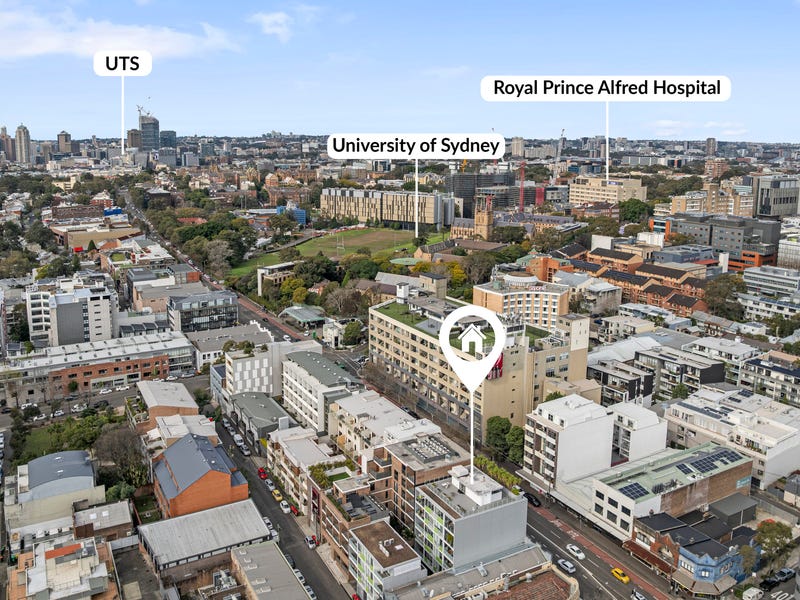
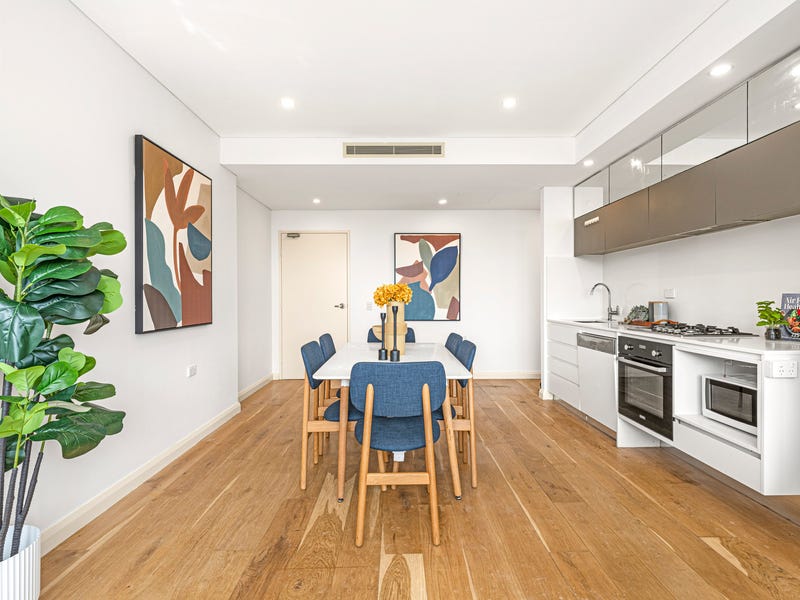
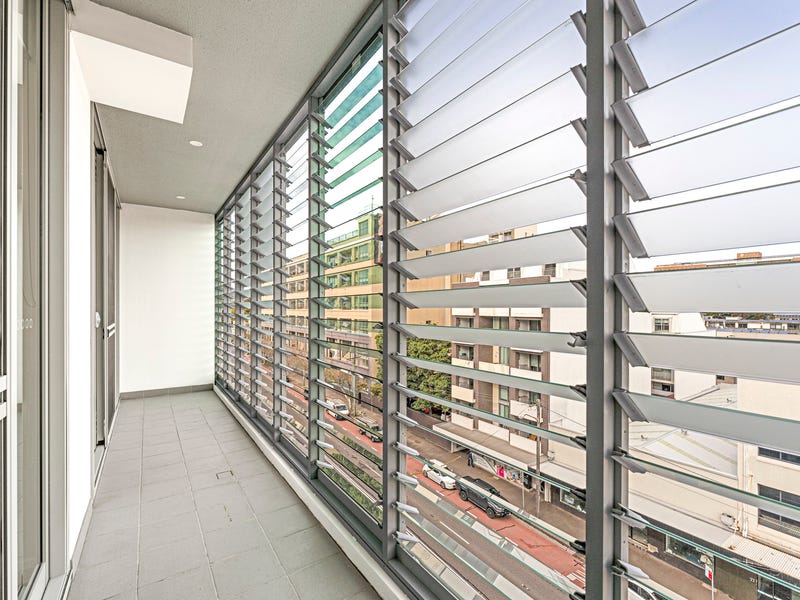
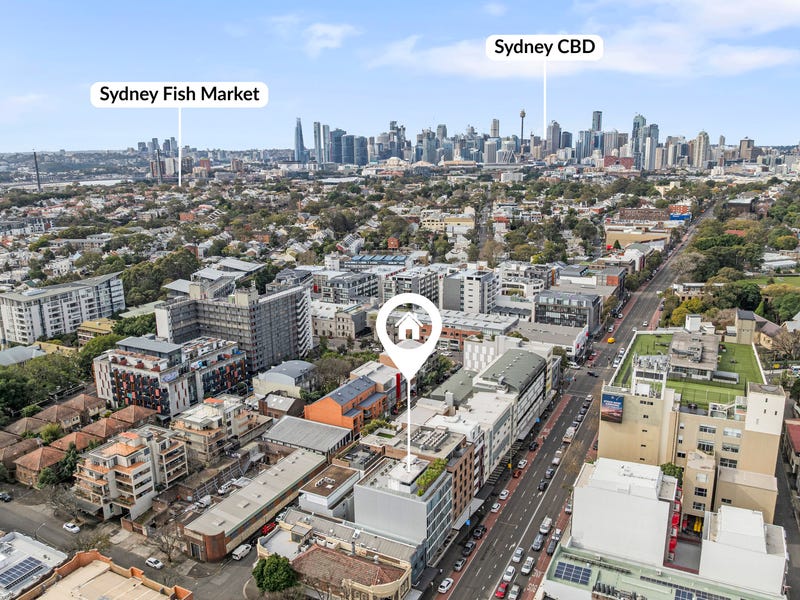
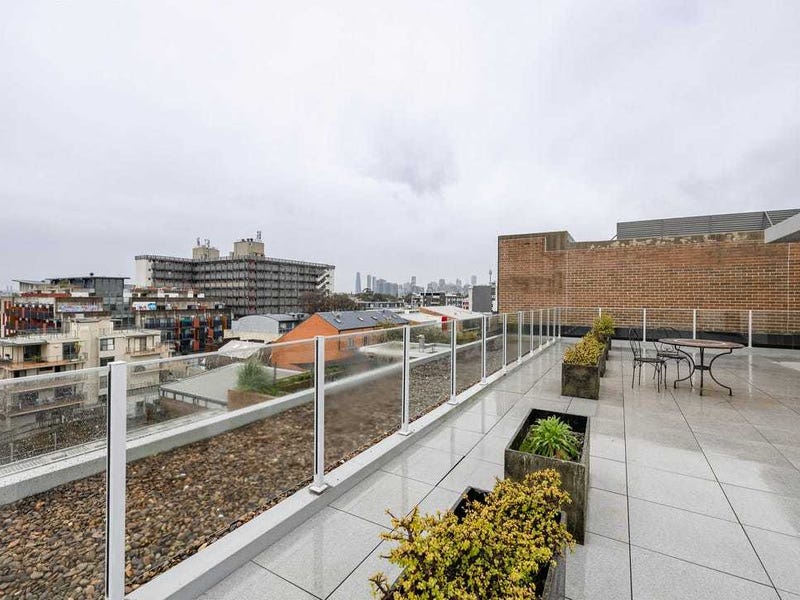
3 bed · 2 bath · 1 car · Apartment / Unit
Asking price cut 4.6% ($62k, from $1,350,000 to $1,288,000) 8 days ago. The vendor has already moved once: negotiate below the NEW asking, not at it.
Your buyer evidence guide
The useful records, what they mean, and the questions they leave open. Start here, then explore the evidence below.
The listing we observed
Listing details describe the advertised home. They do not verify its condition or approved use.
Stone Real Estate - Beecroft / Castle Hill / Epping · last observed 24 Oct 2026The strata scheme
Scheme size provides context. It does not tell us the current levies, finances or condition of the building.
NSW strata register · registered 2015These are recorded events, not evidence of the seller's motivation.
Use these with the agent and your independent advisers. An answer is something to verify, not a fact we have recorded.
The estimate is a model output. The records are evidence. Your inspection and document checks fill the gaps.
This is a comparison with the evidence we hold, not a valuation or a recommended offer.
crime index: 100 — well above sydney average · 16 min walk to Newtown · ~8 min train to the CBD · trains ~every 4 min at peak
These are due-diligence prompts, not a verdict on this property.
66 days since our daily sweep first saw this listing.
The portal's own campaign may have started slightly earlier than our first sighting. Longer campaigns tend to mean more negotiating room — the board's "Longest listed" sort exists for exactly that reason.
$1300–$1700/wk is what 3-bed units in 2050 actually transact for (middle half of 42 bonds lodged, last 12 mo · median $1500/wk — NSW Fair Trading, CC BY).
2019Q1 → 2026Q2: $640 → $870/wk · +6% over the last 12 months (latest four quarters averaged against the previous four) — quarterly new-tenancy medians for units in 2050, all bedroom counts pooled.
Asking rents are what agents hope for; bond figures are what tenants actually signed at (NSW Fair Trading bond lodgements, CC BY). No yield % is derived here: each rent above is a different grain from this home's price, and a ratio of two grains reads as precision it doesn't have. New-tenancy rents run hotter than sitting rents. Not financial advice.
Measured like-for-like growth ≈ 2.4%/yr — 1-bed sold-price medians across 16 quarters (55 sales).
Suburb-level, from published auction results. No single building has enough sales for a block-level series, so this is the honest grain; sales-mix shifts move raw medians, and the measured rate (when shown) controls for bed count.
| Address | Sold | Price | Beds | Agency |
|---|---|---|---|---|
| 35/5-13 Larkin Street | 25 May 2026 | $1,080,000 | 2 | Harris Partners |
| 11/1 Barr Street | 22 Jan 2025 | $1,155,000 | 2 | Harris Partners |
| 204/1 Layton Street | 22 Nov 2024 | $1,460,000 | 2 | Harris Partners |
| 106/1 Sterling Circuit | 24 Sept 2024 | $1,300,000 | 2 | Harris Partners |
| 103/1 Layton Street | 21 Dec 2023 | $1,200,000 | 2 | Harris Partners |
Prices as published on the selling agency's own website (their sold pages) — includes private-treaty sales the auction results never see. Only sales the agency chose to publish a figure for appear here.
The 6 listings above are on the market now: same unit category, within 1 bedroom of 3, asking within 20% of this one, in Camperdown or a suburb whose centre is within 3 km — ordered by how close the asking price is. That is the whole rule: a filter, not a recommendation, and nothing here judges which home is better.
Building Commission NSW / Strata Community Association 2023 Strata Defects Survey: 53% of newly registered strata buildings reported at least one serious defect in common property (39% in the 2021 survey). Defects are common, not exceptional — and new does not mean safe (Opal Tower was under a year old).
Get an independent structural and strata inspection before you commit — the defect base rate makes it the single highest-value dollar in the purchase.
We cannot see inside a building — no one can from public records. This section states base rates and observable adjacency only, and will never call a building safe.
Strata plan SP91117 registered 2015 — the building is at least 11 years old · 21 lots in the scheme.
Registration is an age floor, not a build date — a converted building is older than its strata plan. Scheme records from the NSW Strata Hub. © State of New South Wales (Spatial Services, a business unit of the Department of Customer Service NSW). For current information go to spatial.nsw.gov.au.
2026-10-01 — Development site — listing's own words: "STCA" (50 Hopetoun Street, Camperdown, NSW 2050) (listing rea-152501548 (rea), first seen 2026-10-01)
2026-09-01 — Education departure — 8 MISSENDEN ROAD CAMPERDOWN 2050 ($1645k) (institutional-signals.json (PAN-670014, OnlineDA))
2026-08-14 — Development site — listing's own words: "STCA" (89-91 Fowler Street, Camperdown, NSW 2050) (listing rea-152052096 (rea), first seen 2026-08-14)
Dated public signals compiled for this suburb — openings, closures, site sales and institutional moves. Facts with sources, not forecasts.
Newtown NPS (primary) · SSC Blackwattle Bay (secondary)
10 primary schools within 2 km · ICSEA ~1098 — the socio-educational advantage of the school community (My School, national average ~1000): a demographic measure, never a results or quality score.
Suburb-centre approximation for Camperdown — addresses near a boundary can differ. Verify the exact address at School Finder. Intake zones cover government schools only.
Check any Sydney suburb free — Market Mint market-conditions readout, live median, clearance trend and the price model — at aipropertyeye.com. No sign-up for the suburb check; the full board is 7 days free.
Data from published auction results (Domain) and live portal listings. Estimates are never valuations or financial advice. Own this home and want a result corrected? hello@aipropertyeye.com.