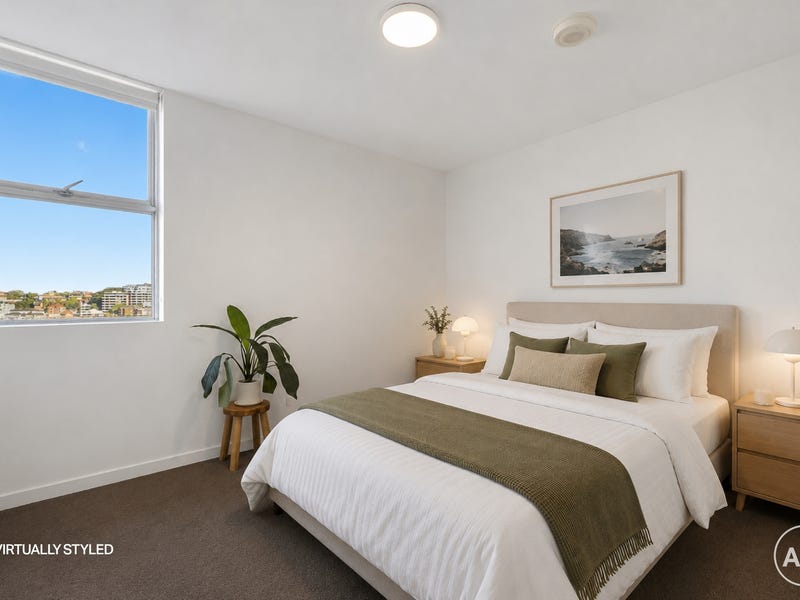
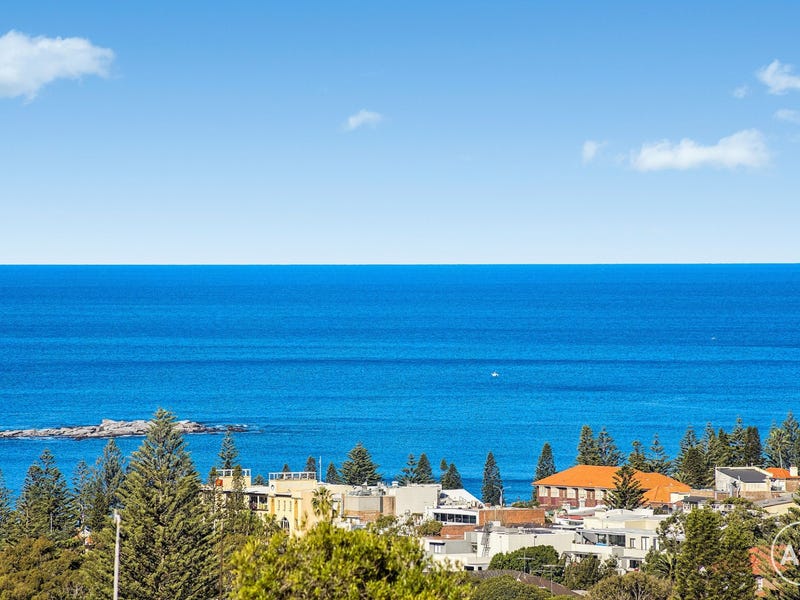
Withdrawn from sale (22 Aug 2026)
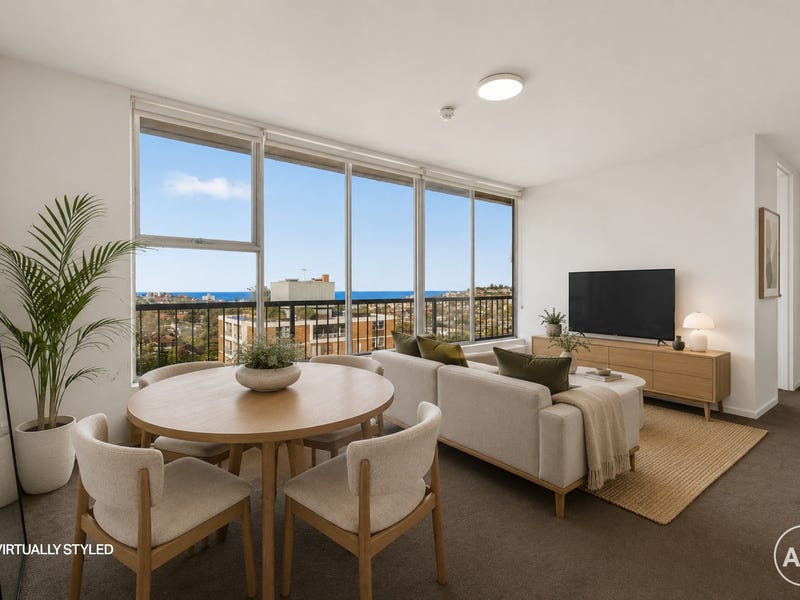
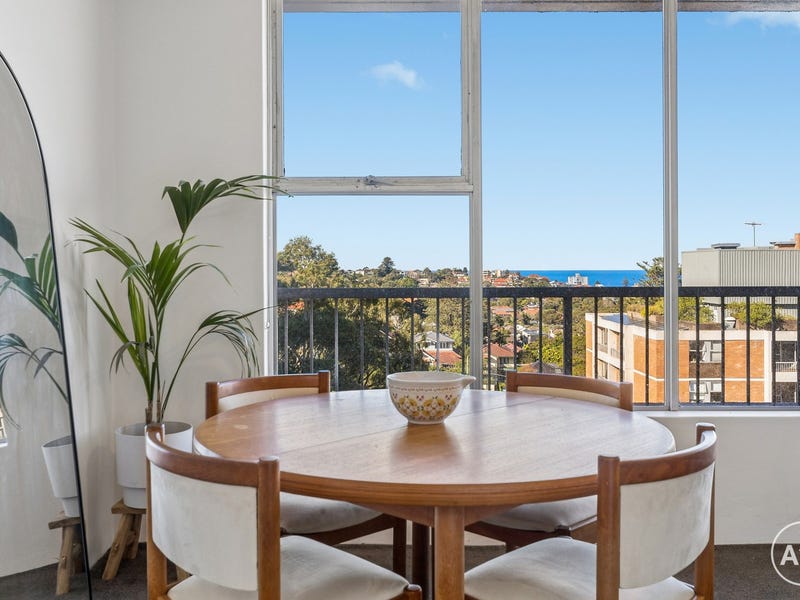
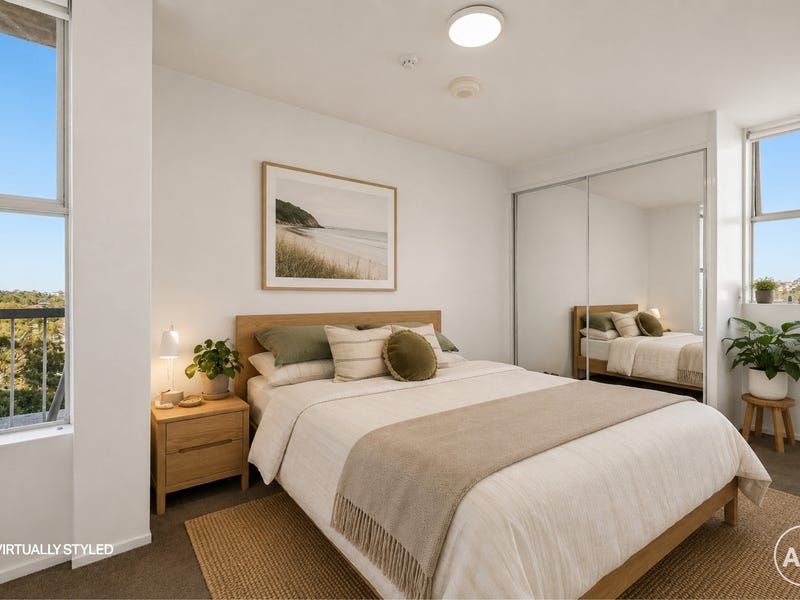
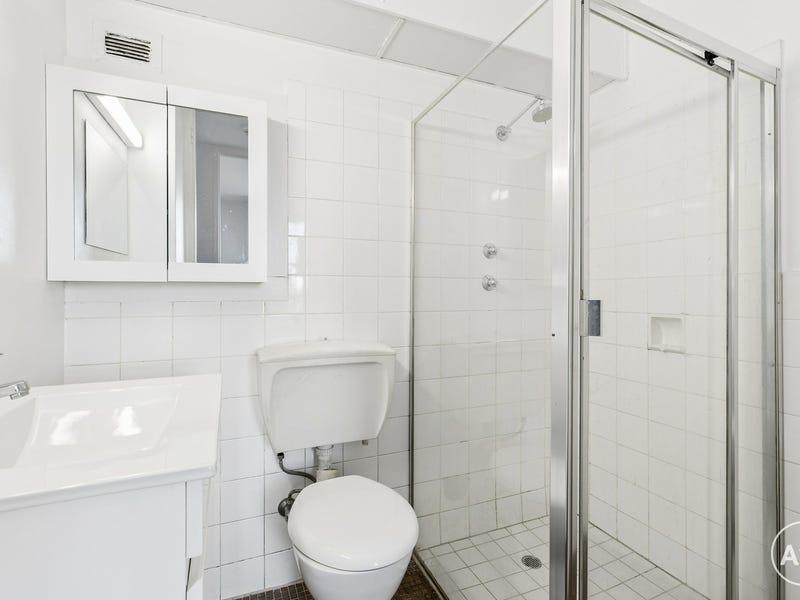
2 bed · 1 bath · 1 car · ApartmentUnitFlat
The campaign was withdrawn before a sale was published.
The Property Brief — what the evidence shows. You draw the conclusion.
Confidence: High — based on 353 comparable auction sales (134 of this exact configuration) · model runs ±11% for this configuration · the model's typical miss is ~11% against published results — every hit and miss
Comparable auction sales
| Address | Config | Sold | When |
|---|---|---|---|
| G05/53-55 Cowper St | 2 bd · 1 ba | $1.75M | Sept 2025 |
| 1/117 Perouse Rd | 2 bd · 1 ba | $1.32M | Sept 2025 |
| 3/2 Dudley St | 2 bd · 1 ba | $1.35M | July 2025 |
| 12/20 Dutruc St | 2 bd · 1 ba | $1.16M | July 2025 |
| 6/25-27 Frenchmans Rd | 2 bd · 1 ba | $1.45M | June 2025 |
| 6B/94 Alison Rd | 2 bd · 1 ba | $1.08M | June 2025 |
Suburb risk flags
flood exposure 52% of the suburb · bushfire exposure 0% · aircraft noise low · crime index: 41 — around sydney average · 1 min walk to Randwick Light Rail · ~25 min light rail to the CBD · light rail ~every 8 min at peak
Where every number comes from
- Fair value: AI PropertyEye price model 2026-08-11-v5 — trained on 146,492 published auction sales; configuration-level (suburb × type × beds), not an appraisal of this exact home
- Comps: published Domain auction results for Randwick — suburb × configuration matches, not hyper-matched to this address
- Risk flags: suburb-level overlays (BOCSAR crime, flood/bushfire intel, aircraft bands, GTFS transit) — NOT a per-parcel assessment
Rent evidence — asking vs transacted, Randwick · postcode 2031
$850–$1050/wk is what 2-bed units in 2031 actually transact for (middle half of 336 bonds lodged, Q2 2026 · median $950/wk — NSW Fair Trading, CC BY).
2019Q1 → 2026Q2: $620 → $900/wk · +5% over the last 12 months (latest four quarters averaged against the previous four) — quarterly new-tenancy medians for units in 2031, all bedroom counts pooled.
Asking rents are what agents hope for; bond figures are what tenants actually signed at (NSW Fair Trading bond lodgements, CC BY). No yield % is derived here: each rent above is a different grain from this home's price, and a ratio of two grains reads as precision it doesn't have. New-tenancy rents run hotter than sitting rents. Not financial advice.
Growth trend — Randwick units at auction
Measured like-for-like growth ≈ 1.7%/yr — 2-bed sold-price medians across 17 quarters (199 sales).
Suburb-level, from published auction results. No single building has enough sales for a block-level series, so this is the honest grain; sales-mix shifts move raw medians, and the measured rate (when shown) controls for bed count.
Published auction results at this address
| Auction week | Result | Price | Agency |
|---|---|---|---|
| 22 Aug 2026 | Withdrawn | withheld | Agents and Co Property Group |
From Domain's published weekly auction results — individual outcomes as published; withheld prices stay withheld.
Agencies' own published sales nearby — Randwick, around 2 beds
| Address | Sold | Price | Beds | Agency |
|---|---|---|---|---|
| 1/107 Alison Road | 6 Nov 2025 | $1,135,000 | 2 | Harris Partners |
| 1f/16 Bligh Place | 19 Mar 2024 | $650,000 | 1 | Harris Partners |
Prices as published on the selling agency's own website (their sold pages) — includes private-treaty sales the auction results never see. Only sales the agency chose to publish a figure for appear here.
Similar properties — on the market now
The 6 listings above are on the market now: same unit category, within 1 bedroom of 2, asking within 20% of this one, in Randwick or a suburb whose centre is within 3 km — ordered by how close the asking price is. That is the whole rule: a filter, not a recommendation, and nothing here judges which home is better.
↩ Withdrawn from auction — what happens next
Withdrawn from auction isn't the end of a sale — of withdrawn Sydney homes that went on to sell, half sold within 65 days.
63% sold within three months of the scheduled auction.
1,547 withdrawn-then-sold homes across Sydney. We don't publish a price figure for withdrawn homes: the measured gap is too unstable to stand behind, and a number we can't defend is worse than none. Based on withdrawn homes that later sold. Homes that never sold aren't in the figure — withdrawal sometimes means a private deal was already done, and sometimes means the listing simply ended.
Planning & zoning — R3 Medium Density Residential
Townhouses, villas and low-rise units permitted — expect gradual medium-density infill.
Heritage conservation area — St Mark's. The property sits in a heritage conservation area — the streetscape is protected, so visible/external changes are controlled. It's area-wide, not this building specifically; it tends to preserve character and value.
Zone R3 (Medium Density Residential) under the RANDWICK LEP · heritage from the NSW Heritage Map layer, from the NSW ePlanning layers at this address's geocoded point — a guide, not a parcel-level legal check. Confirm the exact lot at the NSW Planning Portal.
Development applications — at & near this address
| Where | Proposal | Status | Outcome | Est. cost | Lodged |
|---|---|---|---|---|---|
| ~64 m · 8 Chapel Street Randwick 2031 | Temporary Building, Structure Or Use, Temporary Structure | Under Assessment | not on record | $206k | 2026-04-30 |
| ~133 m · 60 St Marks Road Randwick 2031 | Dwelling House, Alterations Or Additions To An Existing Building Or Structure | Determined | not on record | $172k | 2026-03-02 |
| ~149 m · 62 St Marks Road Randwick 2031 | Dwelling House, Alterations Or Additions To An Existing Building Or Structure, Balcony, Deck, Patio, Terrace Or Verandah · 1 new dwelling | Determined | not on record | $1.64M | 2025-06-12 |
Development application data © NSW Department of Planning and Environment, used under CC BY 4.0. Matched at this exact address or within ~150 m of its geocoded point — proximity evidence, not a parcel-level check. Lodged means proposed, not approved or built. Outcome comes from a separate NSW dataset that stops in Nov 2023: applications determined after that, or still undetermined, read “not on record” — which means we don't know, never that it was refused. “Status” is the council's own workflow state and “Determined” on its own does not say which way it went. Verify any application on the NSW Planning Portal.
Construction risk — what no listing tells you
Building Commission NSW / Strata Community Association 2023 Strata Defects Survey: 53% of newly registered strata buildings reported at least one serious defect in common property (39% in the 2021 survey). Defects are common, not exceptional — and new does not mean safe (Opal Tower was under a year old).
Get an independent structural and strata inspection before you commit — the defect base rate makes it the single highest-value dollar in the purchase.
We cannot see inside a building — no one can from public records. This section states base rates and observable adjacency only, and will never call a building safe.
What's changing in Randwick — recent local signals
2026-08-08 — South Coogee to Kingsford walking & cycling corridor (stage-zero.json (date = register entry, not decision — check stageNote for the real dates))
2026-08-08 — Kingsford–Coogee greenway concept (Warren and Mahoney) (stage-zero.json (date = register entry, not decision — check stageNote for the real dates))
2026-07-04 — Development site — listing's own words: "Development site" (1 Llanfoyst Street, Randwick, NSW 2031) (listing rea-150518040 (rea), first seen 2026-07-04)
Dated public signals compiled for this suburb — openings, closures, site sales and institutional moves. Facts with sources, not forecasts.
School catchments
Randwick PS (primary) · Randwick HS (secondary)
6 primary schools within 2 km · ICSEA ~1112 — the socio-educational advantage of the school community (My School, national average ~1000): a demographic measure, never a results or quality score.
NSW DoE intake zones at this address's geocoded point — tighter than a suburb-level guess, but geocodes carry a few metres of error and boundaries change with reviews. Verify the exact address at School Finder. Intake zones cover government schools only.
Want the numbers agents don't volunteer?
Check any Sydney suburb free — Market Mint market-conditions readout, live median, clearance trend and the price model — at aipropertyeye.com. No sign-up for the suburb check; the full board is 7 days free.
Data from published auction results (Domain) and live portal listings. Estimates are never valuations or financial advice. Own this home and want a result corrected? hello@aipropertyeye.com.