Keep your inspection notes together. Saved on this browser only; no account needed.
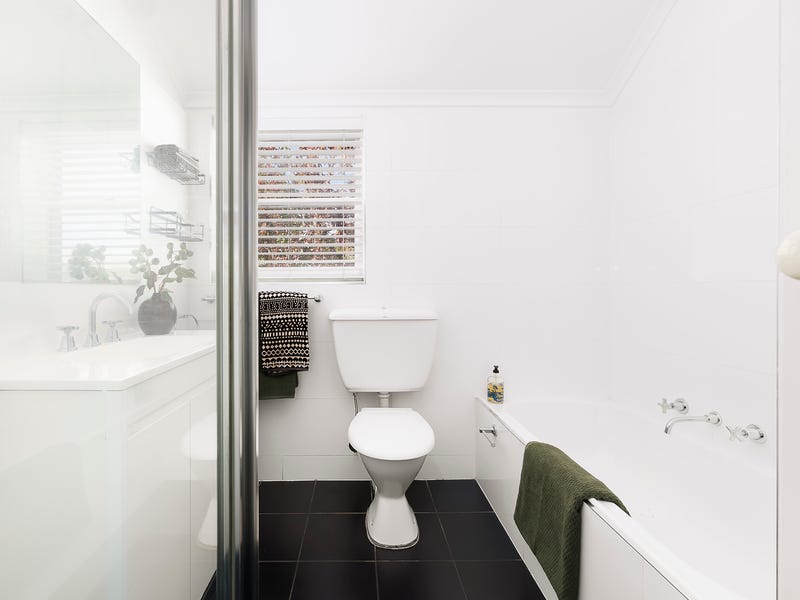
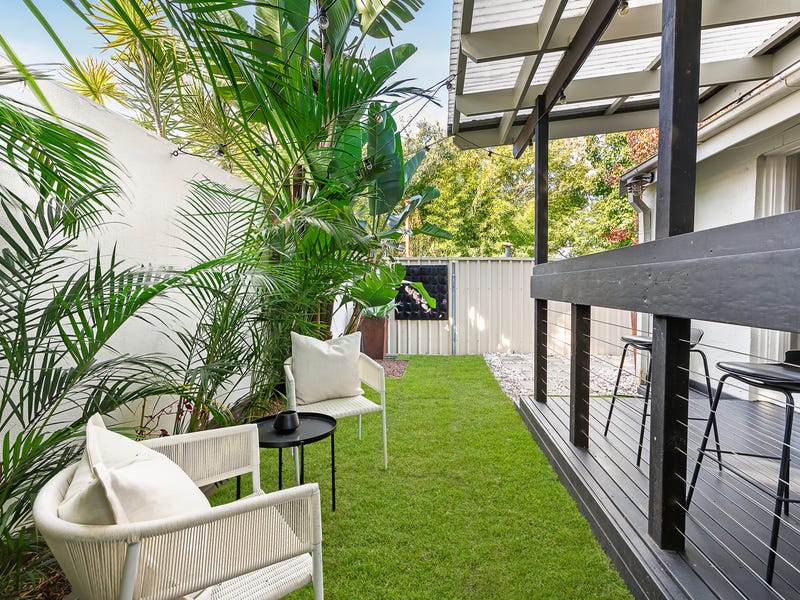
← swipe · 10 photos
Withdrawn from sale (5 Sept 2026)
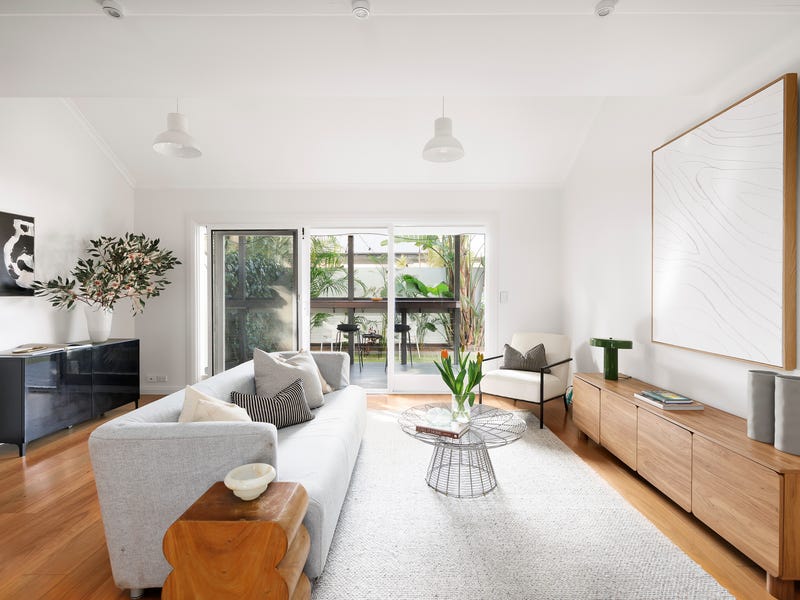
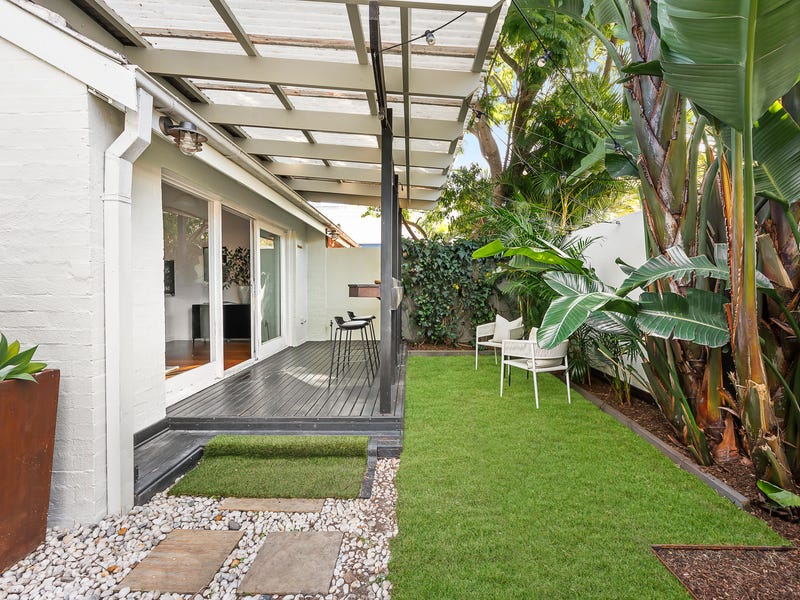
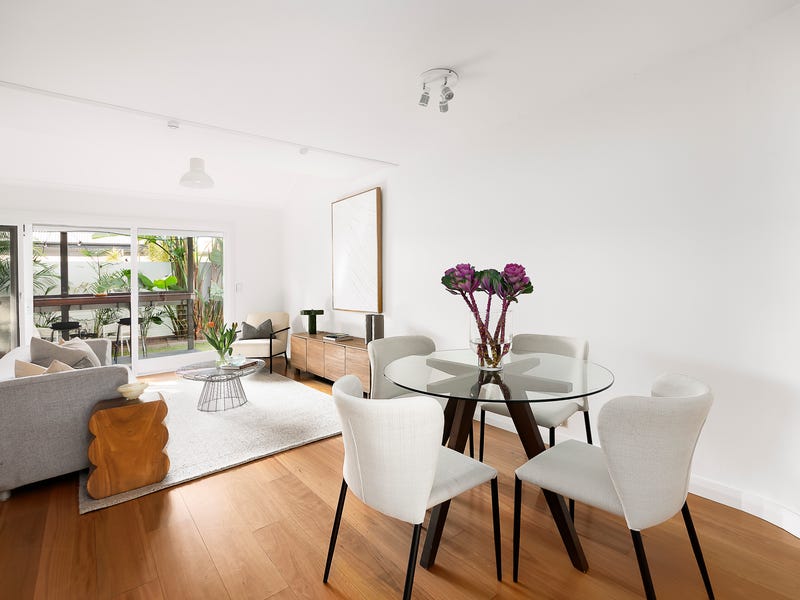
3 bed · 2 bath · 2 car · House
The campaign was withdrawn before a sale was published.
Your buyer evidence guide
Understand the home before the offer.
The useful records, what they mean, and the questions they leave open. Start here, then explore the evidence below.
How much price evidence fits
25 sales in the wider suburb/type pool
The wider pool is not a set of identical homes. Bedroom count, condition and location within the suburb affect comparability.
Published auction evidence · model trained through 2026-09-15
Planning activity nearby
6 recorded applications at or near this address
An application is not an approval or a promise that building work will happen. Location and stage matter.
NSW Planning Portal · individual records in Explore the area
What deserves a closer look
No dated campaign events are available here. That does not establish that the asking price or agent has never changed.
What we still cannot tell you
We do not have a current listing in this page's evidence. An address record is not proof that a home is for sale.
No settled-sale history is available in this page's records. This does not mean the home has never sold.
Direct price support is limited. Read the comparable sales and the estimate's uncertainty together.
Public records and an automated estimate cannot establish whether the home is defect-free, what the contract contains, or why the owner is selling.
Questions to take to the inspection
Use these with the agent and your independent advisers. An answer is something to verify, not a fact we have recorded.
Which nearby applications affect this home, and what stage has each actually reached?
Which recent sales are most comparable to this home, and how do their size, condition and position differ?
What repairs, alterations or water issues are documented, and what can an independent inspection verify?
Do the planning and heritage records match this exact lot, and what approvals exist for alterations?
The estimate is a model output. The records are evidence. Your inspection and document checks fill the gaps.
Is the asking price plausible?
This is a comparison with the evidence we hold, not a valuation or a recommended offer.
CONSERVATIVE
$2.4M
the calibrated floor
LIKELY FAIR RANGE
$2.4M–$3.28M
around $2.81M mid
STRETCH CAP
$3.28M
$3.99M on the wider 80% band
Confidence: Low — based on 25 comparable auction sales (2 of this exact configuration) · model runs ±16% for this configuration · confidence held at Low — under 20 same-configuration sales · priced from this property's own records: block size · thin comparable support for this configuration — read the range as wider, not as a warning · the model's typical miss is ~11% against published results — every hit and miss
How this estimate was made
Method: AI PropertyEye tree model · trained through 2026-09-15
Inputs used for this home: priced from this property's own records: block size
Comparable support: 25 sales in the wider suburb/type pool; 2 of this exact configuration
When to be more cautious: This configuration has thin direct comparable support, so its range is deliberately wider.
Comparable auction sales
Address
Config
Sold
When
17 Huntington St
3 bd · 2 ba
$2.54M
Feb 2025
100 Burlington St
3 bd · 2 ba
$3.55M
Nov 2024
Suburb risk flags
crime index: 34 — below sydney average · 1 min walk to Crows Nest Metro · ~8 min metro to the CBD · metro ~every 4 min at peak
Where every number comes from
Fair value: AI PropertyEye tree model 2026-09-02-v7-price-model-v6-full-grid, trained through 2026-09-15 — trained on 169,861 published auction sales; priced per address where this home's own records reach the model (see "How this estimate was made"), otherwise at configuration level (suburb × type × beds), not an appraisal of this exact home
Comps: published Domain auction results for Crows Nest — suburb × configuration matches, not hyper-matched to this address
Risk flags: suburb-level overlays (BOCSAR crime, flood/bushfire intel, aircraft bands, GTFS transit) — NOT a per-parcel assessment
What to inspect before you offer
Condition, aspect, renovation and the contract — these can materially change price, and the estimate cannot see them.
6 development applications are recorded at or near this address — check the source records and current status.
Planning controls and heritage status — confirm the exact lot, not just the address-level guide, before relying on development potential.
These are due-diligence prompts, not a verdict on this property.
$1225–$1565/wk is what 3-bed houses in 2065 actually transact for (middle half of 18 bonds lodged, Q2 2026 · median $1362/wk — NSW Fair Trading, CC BY).
2019Q1 → 2026Q2: $800 → $1300/wk · +7% over the last 12 months (latest four quarters averaged against the previous four) — quarterly new-tenancy medians for houses in 2065, all bedroom counts pooled.
Asking rents are what agents hope for; bond figures are what tenants actually signed at (NSW Fair Trading bond lodgements, CC BY). No yield % is derived here: each rent above is a different grain from this home's price, and a ratio of two grains reads as precision it doesn't have. New-tenancy rents run hotter than sitting rents. Not financial advice.
Development potential — how North Sydney Council treats the work you might do
Refuses 5.6% of the development applications it decides · off-street parking 16.28%(determinations to Nov 2023).
The full outlook — every category with confidence ranges, which plan elements come unstuck, and the heritage effect by category — is under Explore the area.
Published auction results at this address
Auction week
Result
Price
Agency
5 Sept 2026
Withdrawn
withheld
Ray White Lower North Shore Group
29 Aug 2026
Postponed
withheld
Ray White Lower North Shore Group
From Domain's published weekly auction results — individual outcomes as published; withheld prices stay withheld.
↩ Withdrawn from auction — what happens next
Withdrawn from auction isn't the end of a sale — of withdrawn Sydney homes that went on to sell, half sold within 66 days.
62% sold within three months of the scheduled auction.
1,545 withdrawn-then-sold homes across Sydney. We don't publish a price figure for withdrawn homes: the measured gap is too unstable to stand behind, and a number we can't defend is worse than none. Based on withdrawn homes that later sold. Homes that never sold aren't in the figure — withdrawal sometimes means a private deal was already done, and sometimes means the listing simply ended.
Planning & zoning — R2 Low Density Residential
Houses and dual occupancies. A protected low-rise street — little chance of towers next door.
Heritage conservation area — Holtermann Estate B. The property sits in a heritage conservation area — the streetscape is protected, so visible/external changes are controlled. It's area-wide, not this building specifically; it tends to preserve character and value.
Zone R2 (Low Density Residential) under the NORTH SYDNEY LEP · heritage from the NSW Heritage Map layer, from the NSW ePlanning layers at this address's geocoded point — a guide, not a parcel-level legal check. Confirm the exact lot at the NSW Planning Portal.
Development outlook — how often North Sydney Council has refused this kind of work
If you wanted to…
Refused
vs NSW
Applications decided
Alterations & additions
2.27%(1.11–4.62%)
0.9× (NSW 2.63%)
7 refused of 308 · 18 approved with conditions
Off-street parking
16.28%(8.12–29.97%)
6.3× (NSW 2.58%)
7 refused of 43 · 2 approved with conditions
Pool, deck or fence
6.15%(2.42–14.78%)
3.6× (NSW 1.73%)
4 refused of 65 · 3 approved with conditions
Granny flat
too few to rate
— (NSW 4.45%)
1 refused of 2
Knock down & rebuild
8.11%(2.8–21.3%)
0.7× (NSW 11.55%)
3 refused of 37 · 3 approved with conditions
Across all application types North Sydney Council refused 5.6% (3.95–7.88%) of the 536 development applications it decided.
Where these applications come unstuck
The refusal rate above says how strict the council is. This says which part of a plan is exposed — measured across all 192,284 NSW development applications, not just this council. Each is an association: plenty of applications carrying these elements are approved, and nothing here is a verdict on a proposal you haven't made yet.
Alterations & additions — a new vehicle crossing cut into the front boundary (refused 7.27% vs 2.59% for this kind of work generally — 2.8×, on 220 applications); excavation or a new lower level (refused 6.71% vs 2.54% for this kind of work generally — 2.64×, on 611 applications)
Off-street parking — a new vehicle crossing cut into the front boundary (refused 8.45% vs 2.42% for this kind of work generally — 3.49×, on 284 applications)
Pool, deck or fence — excavation or a new lower level (refused 6.22% vs 1.61% for this kind of work generally — 3.88×, on 659 applications); full demolition and rebuild (refused 4.97% vs 1.6% for this kind of work generally — 3.12×, on 965 applications)
Knock down & rebuild — excavation or a new lower level (refused 25.78% vs 9.36% for this kind of work generally — 2.75×, on 256 applications); full demolition and rebuild (refused 19.91% vs 10.46% for this kind of work generally — 1.9×, on 221 applications)
Because this address sits in a heritage listing
Heritage does not make everything harder — it depends entirely on what you want to do, and for some work it makes approval more likely. Measured across NSW by category:
Alterations & additions — heritage listing raises the refusal rate: 4.39% on heritage-affected land vs 2.27% elsewhere
Off-street parking — heritage listing raises the refusal rate: 7.37% on heritage-affected land vs 2.29% elsewhere
Pool, deck or fence — heritage listing raises the refusal rate: 4.56% on heritage-affected land vs 1.62% elsewhere
Granny flat — heritage listing raises the refusal rate: 9.63% on heritage-affected land vs 4.4% elsewhere
Knock down & rebuild — heritage listing lowers the refusal rate: 7.1% on heritage-affected land vs 12.68% elsewhere — applications here are typically pre-advised and conservative
These are NSW-wide rates for heritage-affected applications, not North Sydney Council-specific, and they describe applications rather than this property. The zoning section above records the actual listing at this address.
Determinations lodged on the NSW Planning Portal up to Nov 2023 — the published dataset stops there, so this is a record of how the council has behaved, not a forecast and not a statement about any particular application. Rates cover development applications only; modifications and reviews of an earlier decision are excluded. A rate is shown only where at least 30 applications were decided — below that the counts are given instead, because a percentage from a handful of decisions is not a fact about a council. "Approved with conditions" is a consent, not a refusal, and is never counted as one.
Development applications — at & near this address
Where
Proposal
Status
Outcome
Est. cost
Lodged
~35 m · 73 Burlington Street Crows Nest 2065
Alterations And Additions To Residential Development · 1 new dwelling
Withdrawn
not on record
$899k
2020-11-30
~35 m · 73 Burlington Street Crows Nest 2065
Semi-Attached Dwelling, Alterations And Additions To Residential Development, Garages, Carports And Car Parking Spaces · 1 new dwelling
Determined
Approved
$797k
2021-05-19
~35 m · 96 Burlington Street Crows Nest 2065
Dwelling House, Alterations Or Additions To An Existing Building Or Structure, Garage, Carport Or Carparking Space · 1 new dwelling
Determined
not on record
$444k
2026-07-15
~42 m · 100 Burlington Street Crows Nest 2065
Attached Dwelling, Demolition, Dwelling House · 1 new dwelling
Determined
not on record
$145k
2026-01-06
~78 m · 87 Ernest Street Crows Nest 2065
Subdivision Of Land
Determined
Approved
$10k
2022-10-14
~80 m · 82 Falcon Street Crows Nest 2065
Erection Of A New Structure, Garage, Carport Or Carparking Space
What's changing in Crows Nest — recent local signals
2026-10-14 — Development site — listing's own words: "STCA" (100 Atchison Street, Crows Nest, NSW 2065) (listing rea-152624076 (rea), first seen 2026-10-14)
2026-09-23 — Development site — listing's own words: "STCA" (189 Chandos Street, Crows Nest, NSW 2065) (listing rea-152430264 (rea), first seen 2026-09-23)
2026-08-25 — Development site — listing's own words: "STCA" (1/250 Pacific Highway, Crows Nest, NSW 2065) (listing rea-152132144 (rea), first seen 2026-08-25)
Dated public signals compiled for this suburb — openings, closures, site sales and institutional moves. Facts with sources, not forecasts.
School catchments
Anzac Park PS (primary) · Cammeraygal HS (secondary)
6 primary schools within 2 km · ICSEA ~1155 — the socio-educational advantage of the school community (My School, national average ~1000): a demographic measure, never a results or quality score.
NSW DoE intake zones at this address's geocoded point — tighter than a suburb-level guess, but geocodes carry a few metres of error and boundaries change with reviews. Verify the exact address at School Finder. Intake zones cover government schools only.
Want the numbers agents don't volunteer?
Check any Sydney suburb free — Market Mint market-conditions readout, live median, clearance trend and the price model — at aipropertyeye.com. No sign-up for the suburb check; the full board is 7 days free.
Data from published auction results (Domain) and live portal listings. Estimates are never valuations or financial advice. Own this home and want a result corrected? hello@aipropertyeye.com.